We read the footnotes.
Twenty years of data, the desk's notes on every name we cover, and tools that don't pretend to be anything else.
Get the full research platform
Screen 4,500+ stocks, track your portfolio, and read the analyst desk. Everything except the premium tools, free for as long as you want.
Just want the Sunday read?
Market commentary, top picks recap, and the latest research from the analyst desk. One email, every Sunday.
Latest from the analysts.
View allRoughly 10% of our research is free and open to everyone. The more actionable, high-value analysis is reserved for Pro+ members.
Healthy US Economy? Not Really.
Annual deficits running $4-5 trillion mountain of assets and liabilities built up since 2008 ten-to-twenty-year decline path remaining

Weekly Briefing: The 2026 Midterm Realities, Polling Illusions, & The Market Bubble Squeeze
Progressive B-rated pollsters manufacture momentum in Texas and Florida to drive fundraising and force GOP defensive spending, inflating perceived toss-up status Prediction markets in congressional contests largely echo low-liquidity, biased polls rather than provide independent forecasts, avoid relying on them for tactical bets Rust Belt working-class strain - doubled grocery costs, fuel surcharges, rising credit borrowing - creates GOP turnout risk in Michigan and Midwest despite redistricting gains
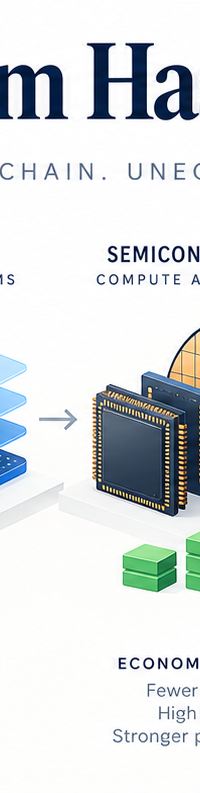
The AI Agent Boom Has a Pricing Problem
Thesis: Agent boom has a pricing mismatch - compute and cloud capture the bulk of spend today, while software vendors must shift from seat to task pricing to defend economics NVIDIA Data Center revenue $89.0bn in quarter ended July 26, +117% YoY; global cloud infrastructure spending $143.4bn in June quarter, +43% YoY Adoption divergence - McKinsey: 88% use AI in >=1 function, only 6% show company-wide profit impact; Infosys/HFS: 14% have scaled agentic AI, 60% of advanced agents still rule-based Hardware and cloud are the primary beneficiaries - Broadcom AI semis $16.7bn, +221% guided $21.7bn; AWS cloud op income $16.6bn (+36.7%); Google Cloud growth +82% Investable signals - chip/cloud multiples elevated (NVDA 24.9x, AVGO 19.4x; CRWD 208x, PANW 94x); monitor ServiceNow/Salesforce usage-based revenue disclosures and hyperscaler capex trajectory as triggers

Firms Are Booming. Households Aren’t. This Week’s Consumer Prints Decide Which Story Is Real.
Carnival est revenue $8.39bn (+3% YoY), EPS $1.35 vs $1.43 LY - monitor net yields, onboard spend, occupancy and forward bookings; bunker fuel near $90s is the key margin tail risk CarMax est revenue ~$7.0bn, EPS $0.66-0.72, options imply 11-15% move - watch retail unit velocity, GPU, loan originations, loss provisions, delinquency rates and days of supply Nike down ~43% YTD, est EPS $0.44 on $11.33bn revenue - audit North America promotional depth, full-price sell-through, DTC performance and Greater China trends for pricing power

Business Investment Holds Up as Consumers Fear Higher Prices: Durable Goods and U Mich Survey
August durable goods flat at $338.6B, core non-defense capital goods +1.6% to $87.629B - nominal gains driven by price moves and order acceleration, not proof of capacity expansion University of Michigan final Sep sentiment 48.1, expectations 46.3, current conditions 50.9; one-year inflation expectations surged to 4.6%, signaling heightened household pricing anxiety Firms and households are pulling demand forward to hedge tariffs, shipping frictions and higher prices, producing a temporary, defensive boost in orders and purchases
An analyst on your bench, fluent in everything GNG knows.
Most assistants guess. This one runs the screener, opens the backtester, simulates the path, then shows its work. Built on top of every dataset we own.
- Ask plain English. The assistant reaches the same data and tools you'd open in a tab.
- Hands off to specialist sub-agents for the backtester, Monte Carlo, the Research Terminal, and screening.
- Shows you the chart it built, the table it pulled, and the math behind the call. No black box.
- Remembers what you care about across chats. Pin a memory once, reference it forever.
Aristocrats beat SPY by 138 bps CAGR with a shallower drawdown. Quality is doing the work here, the yield is incidental.
Research Terminal
Screen the market the way an analyst would.
A limited preview with the top 200 stocks by market cap and 20 columns. Create a free account for the full terminal with 4,500+ companies and 300+ metrics.
Test the thesis before you spend a dollar on it.
Set the basket. Set the rule. We replay the market back to 2005 and show you what would have actually happened, drawdowns and all.
- Twenty years of daily data, replayed honestly, with the costs and taxes you'd actually pay.
- Fixed-share or percentage-weight rebalancing on any cadence you can name.
- Compare two strategies and a benchmark side by side, on one chart.
- Full trade ledger for every entry, exit, dividend, and split.
A thousand futures. One portfolio. Honest probability bands.
Find the fifth-percentile outcome before you find it the hard way. Run the path you actually have to live through, not the average you'd like to.
- Sample from real historical regime windows, not a tidy normal curve, so the tails behave like reality.
- 5th, 50th, and 95th percentile bands across the full horizon.
- Stress-test withdrawals, contributions, and rebalances in one run.
- 1,000 to 10,000 paths per simulation. The slow part is your patience, not the math.
Income, ten years out, with the math written down.
Plug in a portfolio. We compound growth at each name's own pace, watch the payout ratio for stress, and show you the cheque you'd have written every year.
- Per-ticker dividend growth rates, payout-ratio guardrails, and a real coverage view.
- Stacks qualified and ordinary income side by side for tax planning.
- DRIP toggle reinvests at modeled prices, not at today's snapshot.
- Ten-year forecast on any portfolio, watchlist, or model.
Your whole book, two ways to bring it in.
Connect a brokerage in thirty seconds, or paste a year of trades from a CSV. Either way, the numbers reconcile against twenty years of split, dividend, and corporate-action data.
- Link your brokerage with Plaid, or keep it private and type it in yourself.
- Bulk-paste a year of transactions from a CSV and the importer maps them for you.
- Price alerts, dividend alerts, and earnings reminders that fire while you're at the gym.
- Cost basis, realized gains, sector drift, and dividend cadence in one view.
| Ticker | Value | Day | YTD |
|---|---|---|---|
| MSFT | $17,436.72 | +0.84% | +18.4% |
| BRK.B | $11,810.16 | +0.21% | +11.2% |
| KO | $10,368.60 | -0.31% | +6.5% |
| COST | $8,217.45 | +1.42% | +24.8% |
| JPM | $7,143.12 | -0.18% | +9.1% |
Ideas from the desk, with the math next to them.
Pre-built portfolios our analysts actually hold and refresh, plus the monthly Top Picks list. Every position has a reason and a number attached.
- Model portfolios built and held by GNG analysts, with the rationale on every position.
- Top Picks refreshed monthly, the ten names the desk wants on the radar.
- Clone any model into your own tracked book in a click.
- Track each model's drawdown, Sharpe, and contribution per name.
High ROIC, durable margins
25Y+ consecutive raises
FCF yield > 6%, low leverage
Analyst-curated, refreshed monthly
Filter the market the way an analyst would.
Most screeners limit you to fifteen fields and a free-tier paywall on anything useful. We give you the whole desk's field set, plus the option chain when you need it.
- Filter the whole US market on 300+ fundamental, technical, and proprietary fields.
- Save filter sets and re-run them as the market moves.
- Options screening for unusual flow, IV percentile, and probability of profit.
- Export to CSV, push to a watchlist, or hand the set to the AI Console for context.
| Ticker | P/E | Div Yield | Mkt Cap |
|---|---|---|---|
| MSFT | 32.8 | 0.71% | $3.08T |
| AAPL | 29.1 | 0.52% | $2.94T |
| GOOGL | 22.4 | 0.40% | $2.11T |
| CSCO | 16.2 | 2.81% | $218B |
4 of 217 matches