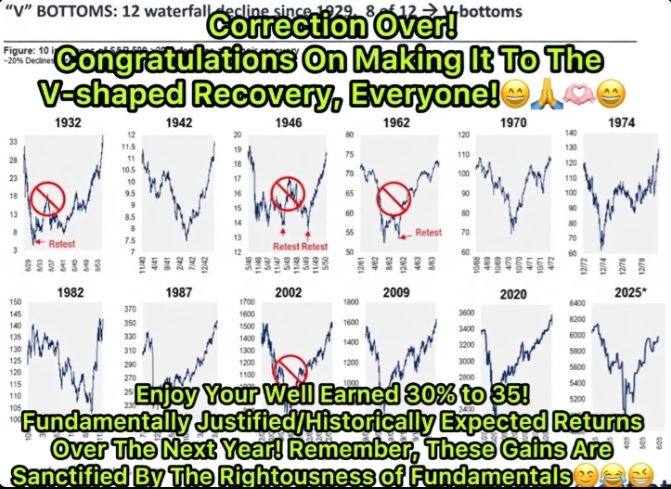

On Monday, I published what might be a rather lucky, though potentially legendary article.
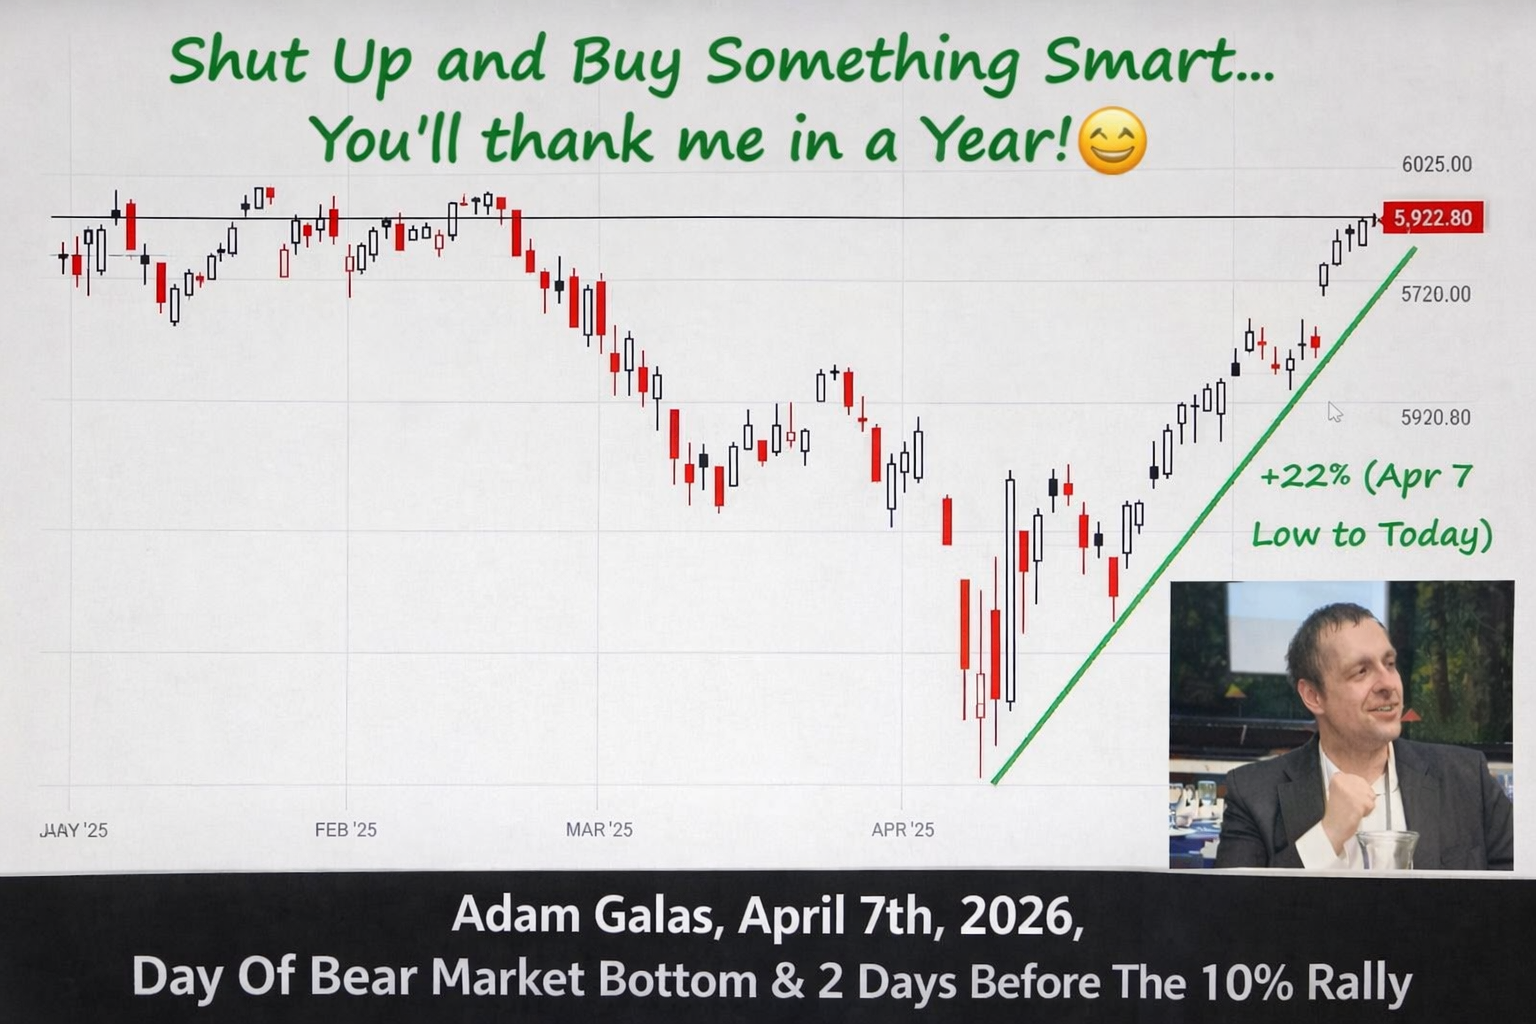
Because in the 2025 bear market, I nailed the bottom (VIX 60 is so rare that it is a VERY high-probability bet).
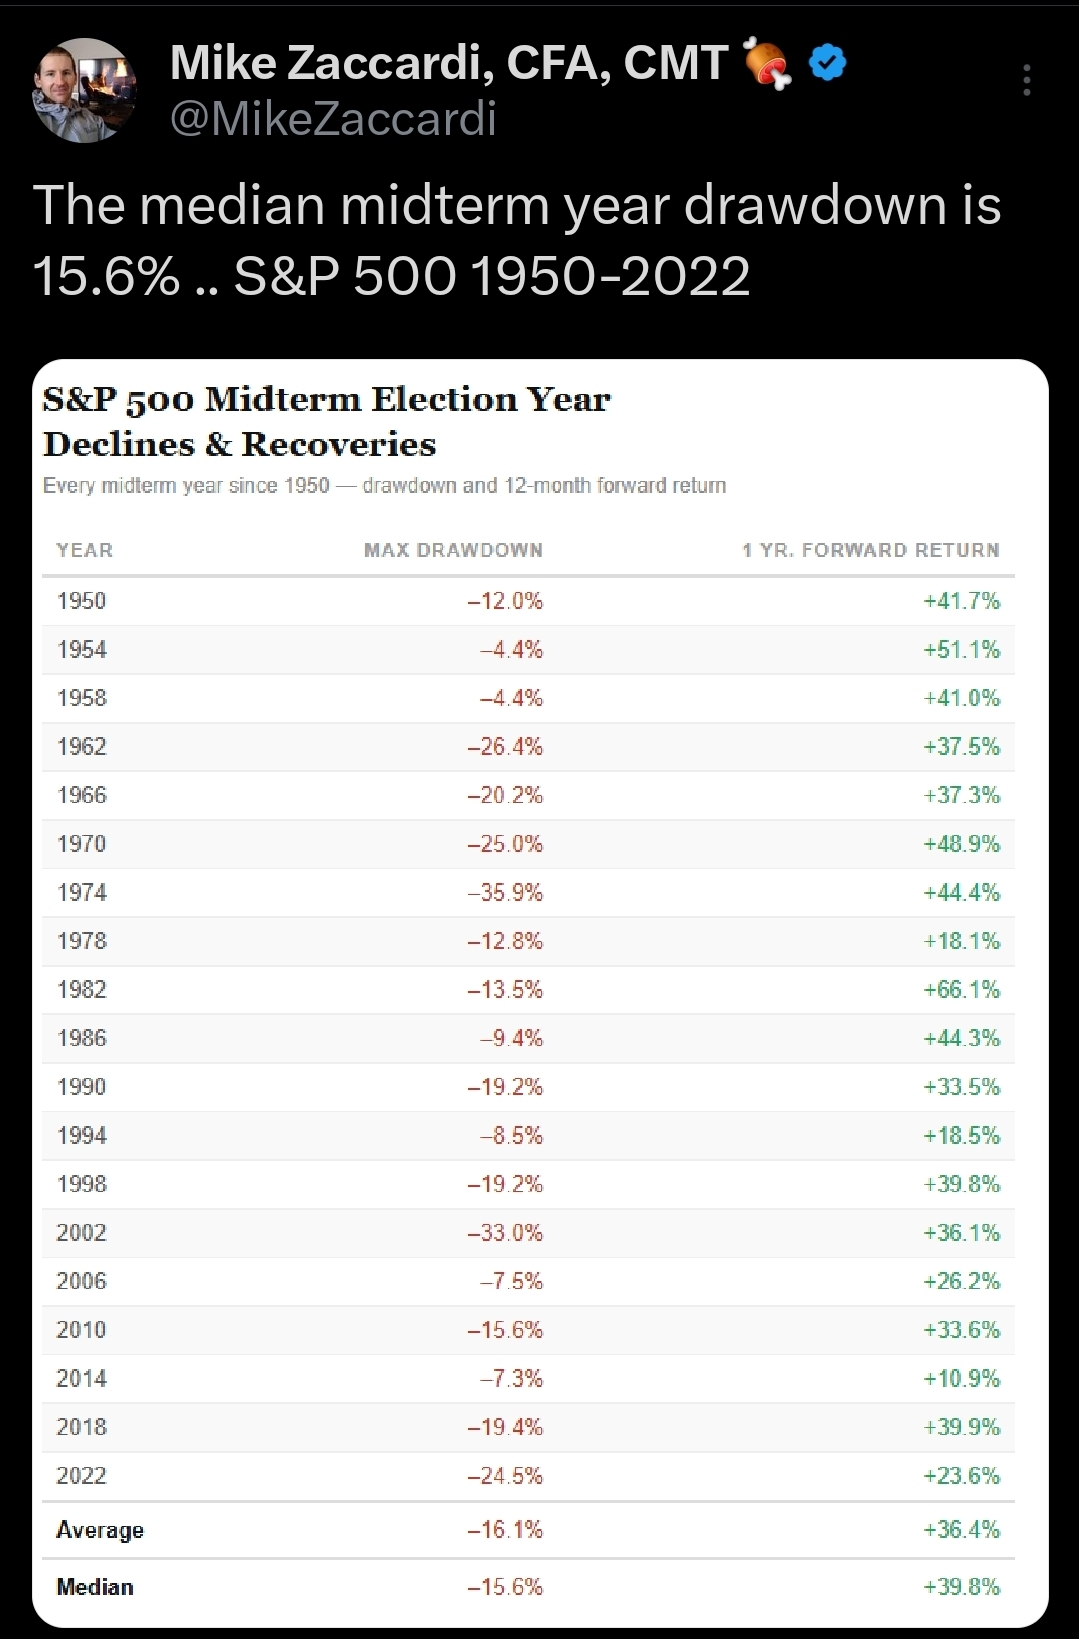
Back in 2025, my confidence on April 7th, expressed in a DK article, plus the chat room, plus social media, came from this table.
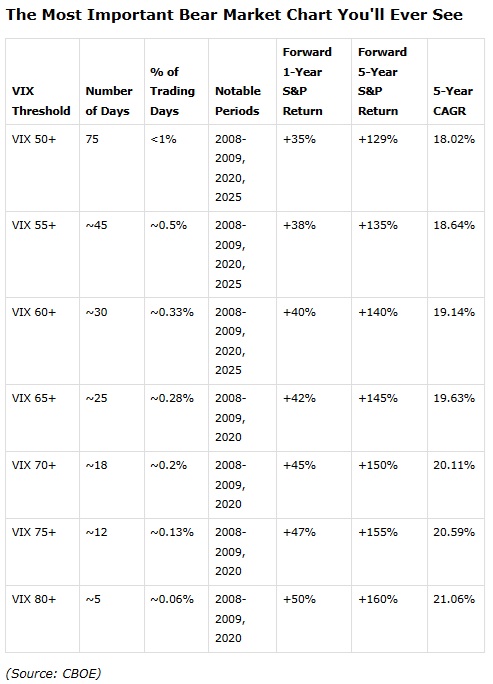
When I saw the VIX hit 60 (by which I mean Torston Slok, Chief Equity Strategist of Apollo, posted a chart on Daily Shot😉, and I saw a table like this from Mike Zacardi, I immediately went to work with Chat GPT Deep Think to research the other VIX data points to build this table. And this data, from CBOE, is ultimately what gave me the confidence to scream from the rooftops, “Shut up and buy something smart! You’ll thank me in a year😉”.
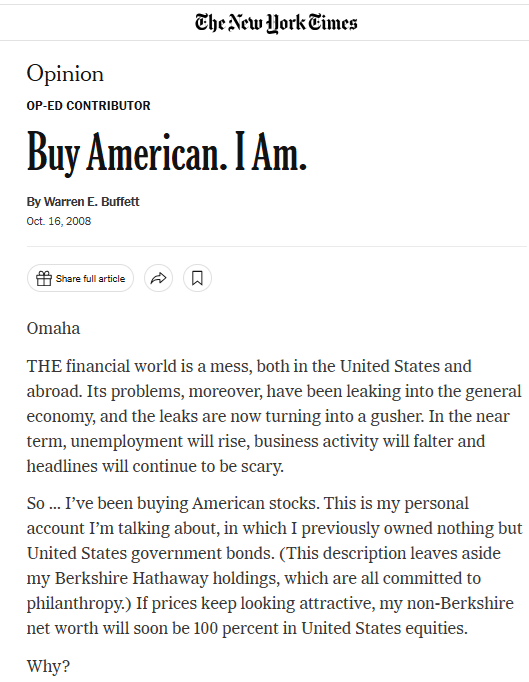
Stocks Were Down 40% When Buffett “Called His Shot.”
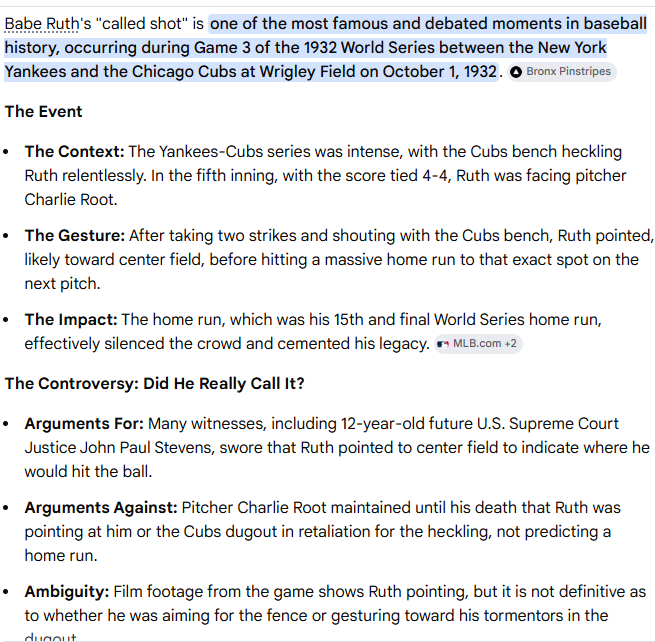
I was lucky on April 7th, and on March 30th, the market bottomed so far. I published yet another “Shut up and buy something smart” article, and if that happens to be the bottom, then I will look like Babe Ruth calling my shot…twice.
The Importance Of “Fundamentally Justified Luck”

All of life (but especially Wall Street) is probability curves.
I don’t have a crystal ball; I just have market history, fundamentals, and an intuitive sense (based on 27 years of investing experience and 13 years as an analyst) about when the timing might be right on something.
Buffett Called His Shot…And Struck Out!
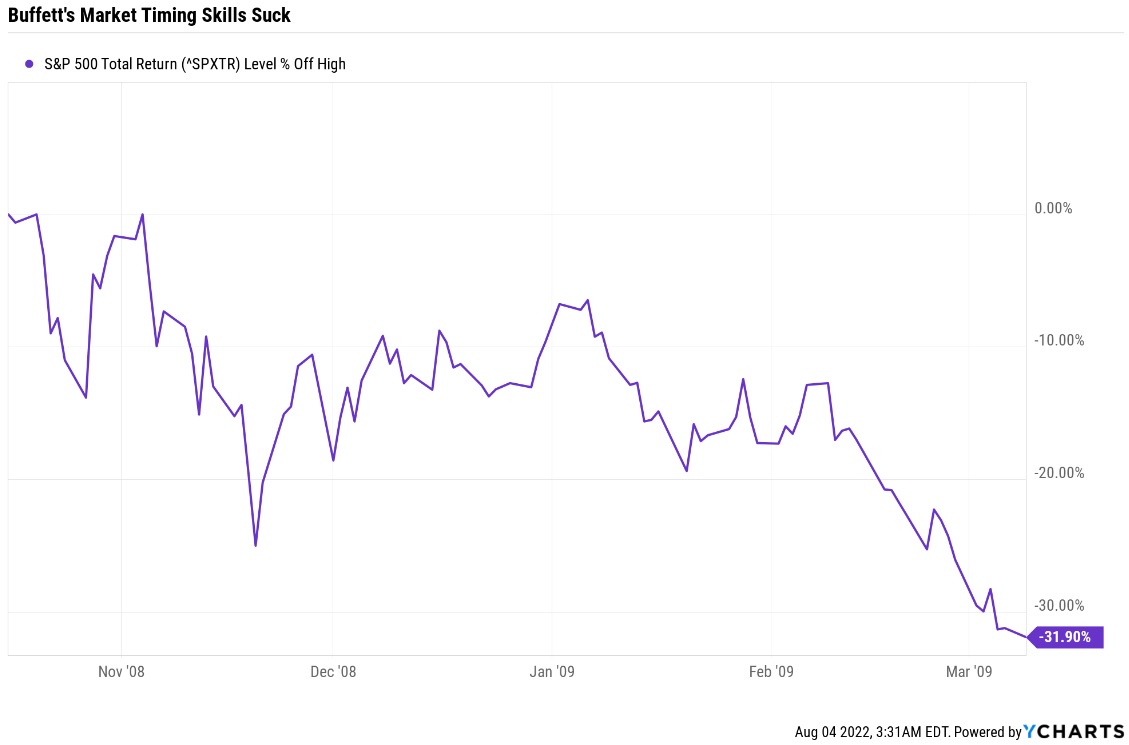
Buffett wrote this after stocks were down 40%... the average decline at the peak of a recessionary bear market at the time.
Stocks then fell 30% more. Bottoming at -58%, the 2nd worst market crash in history...BUT guess what?
Or Did He? 😉
Can you even see where Buffett "was wrong"?😉
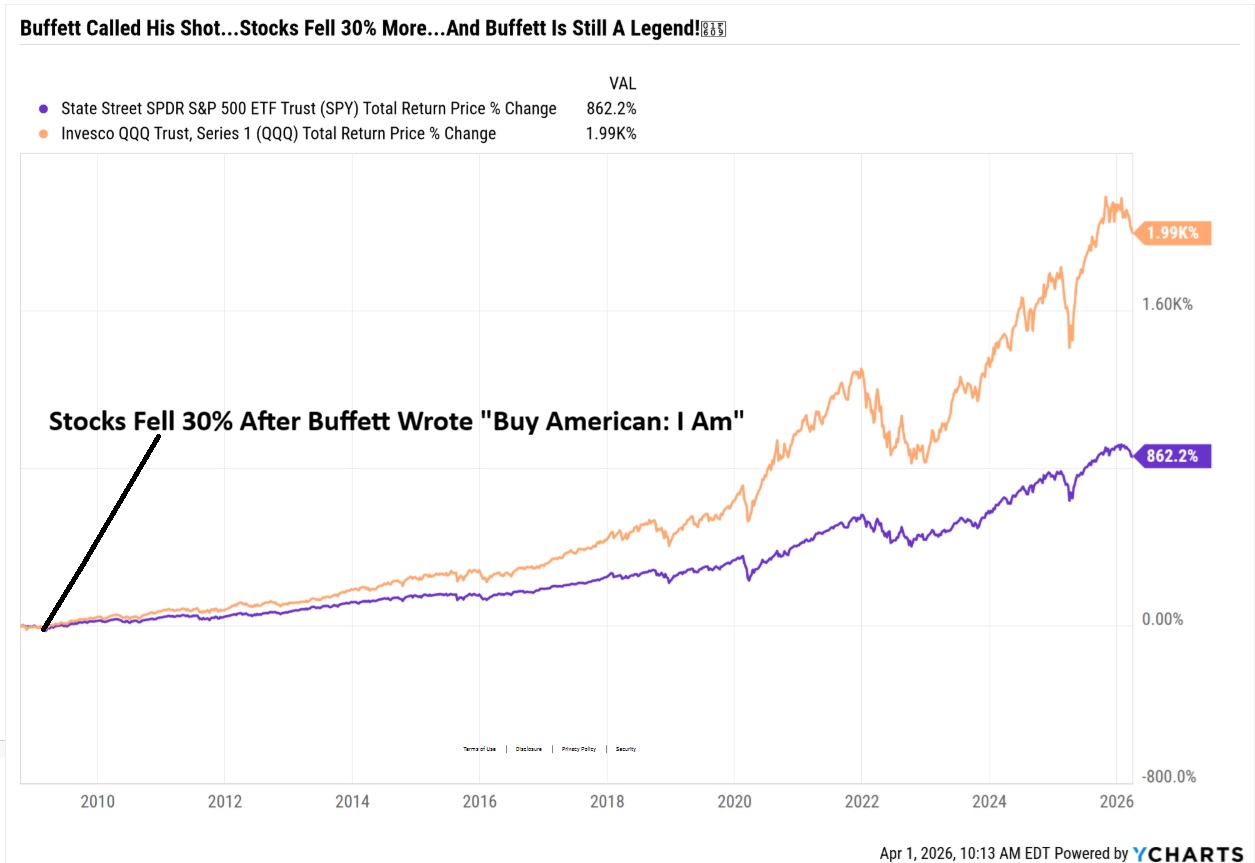
And that’s not measured from the market bottom on March 9th, that’s literally the returns for any buy-and-hold investor who listened to Buffett on October 16th, rode out a 30% decline, and accepted the “Unless the world is literally ending, this is going to work…Close your eyes and come back in a year” mentality that great investors have in scary markets.
The point is that I’m not a genius, I’m just a disciplined financial scientist who has good models. So let me now answer the question that a lot of members have reached out to me in the chat room and private message and asked about.
What Happens After The Correction Bottom? What Do Smart Investors Do Next?
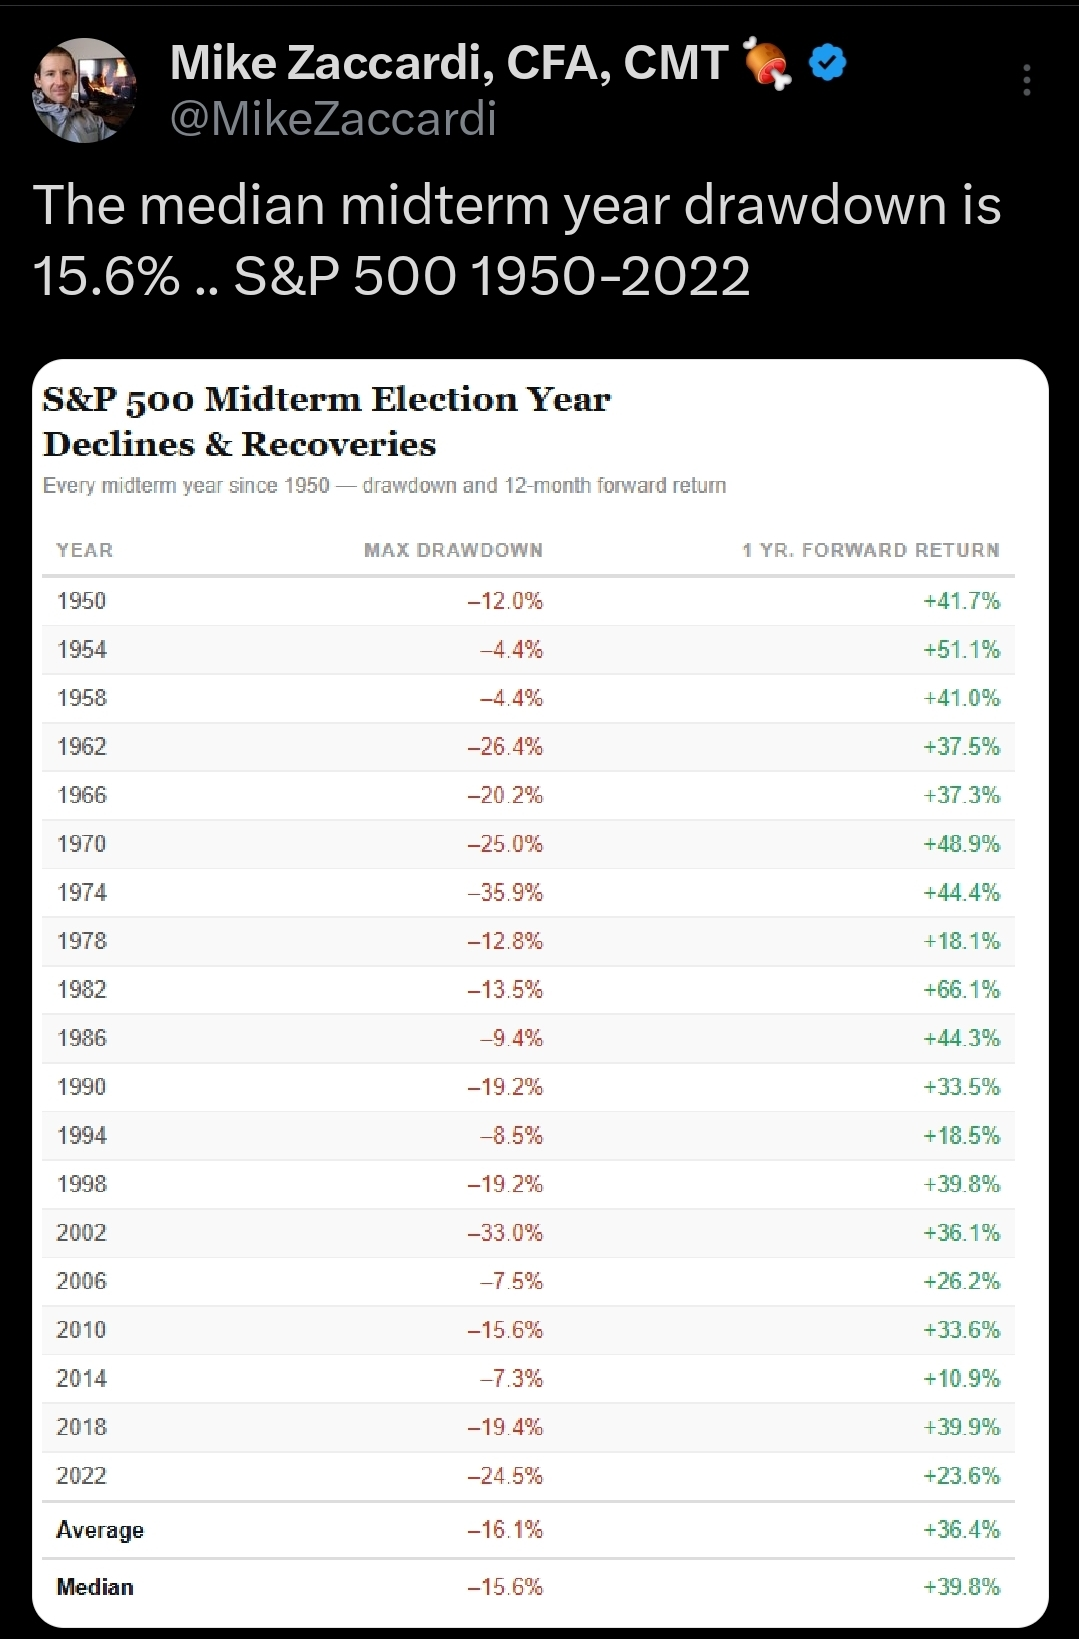
Remember how, in April 2025, at a VIX of 60, the historical 12-month return was 40%? Well, guess what it was on Monday, March 30th?
8% From Historical Bottom = Approximately 40% Upside Potential Over The Next 12 Months
In other words, Historical Median return = fundamentally justified return
Thus “Shut Up And Buy Something Smart…You’ll Thank Me In A Year😉”
Because even though I expected stocks to keep falling for 1 to 3 more weeks, anyone buying on Monday would make a lot of money.
Especially in MSFT, AMZN, and NVDA with 88% to 150% upside potential over the next 12 months.
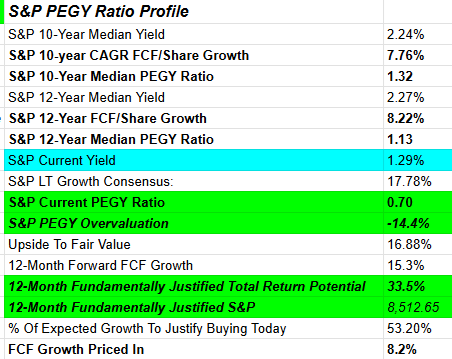
It’s not bravado, it’s not a crystal ball. I’m not the “Oracle of Minnesota”😉It’s just math and probabilities.
That is ridiculous! EVERYONE knows I’m the smoothie king of Minnesota😂
But this brings us to the question of “Now that the correction might be over…what now?”
8.9% Pullback Peak To Trough (Not A Correction Technically) What To Expect Next
The headlines yesterday that sent the market into a buying frenzy are NOT the end of the war…this isn’t the same as the “pause” of April 9th.


The good news is that while the headlines are not “It’s Over!”, the worst of the market panic probably is.
Note PROBABLY (I’m not implementing Plan C just yet.
More on that in a second.
Monday…I’m Not The Only Analyst Pointing Out The Obvious
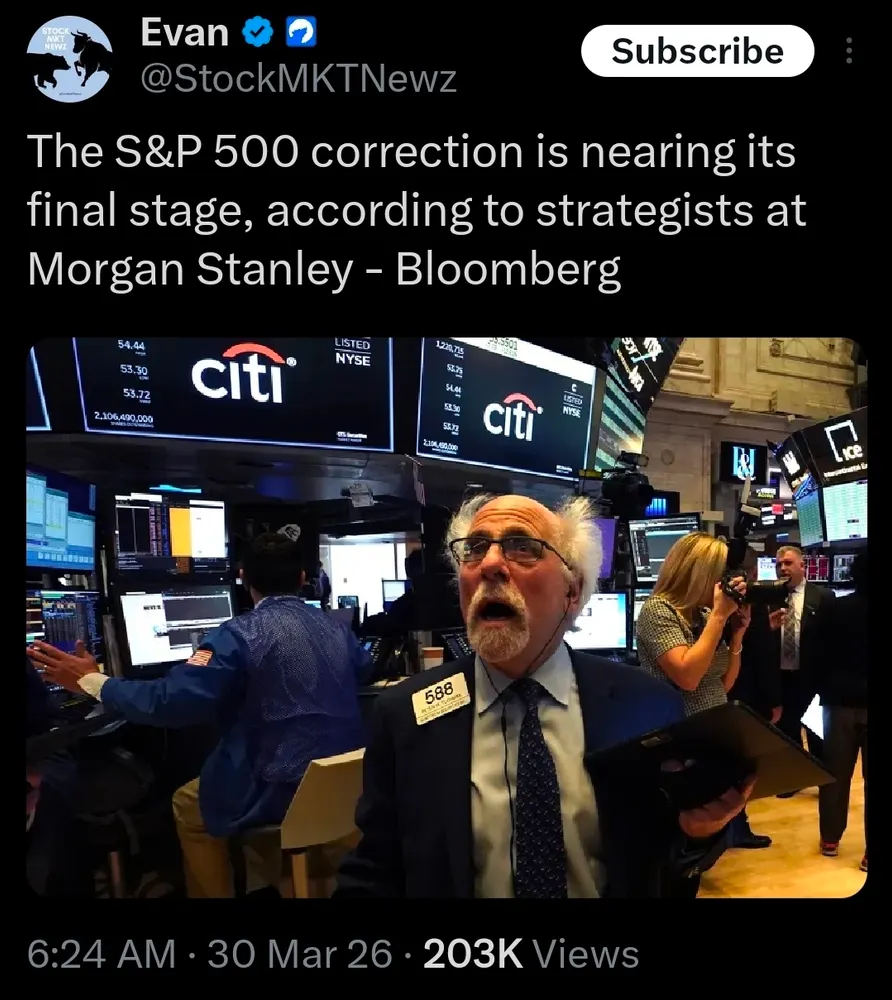
Why is Monday -8.9% PROBABLY the market bottom?
Because the worst case scenario…that the US and Iran get locked into a kind of Russia/Ukraine-like multi-year quagmire that leaves the straits of Hormuz effectively closed for years, and sends crude
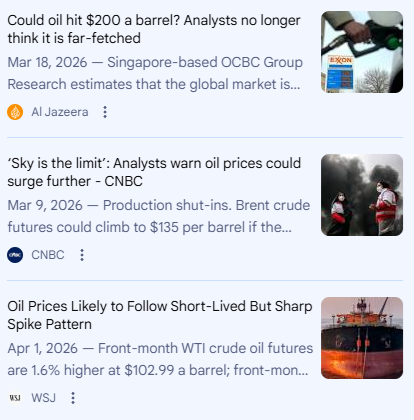
$200 crude = $130 above pre-war levels = $6.25 national average gas prices = -2.6% GDP impact (JPMorgan & Moody’s, and Goldman) close to 0% growth = growth scare correction of -15% to -20% likely.
That’s my “super power”, the “pattern matching neural network” in my head that lets me connect new facts with existing ones to answer the questions that matter most.
And that’s now off the table because both the US and Iran have expressed interest in talking. Those talks might not work out immediately…but the “we’re burning the house to the ground in the name of national honor, FRACK the global economy, this is all-out war!” mentality has been disproven.
Remember that the Pause in tariffs still left tariffs at an average 15% to 20% over the following year!
Just as the peak in COVID cases came in January 2022! After the Vaccine was out for a year!
Remember March 9th, 2009? The market bottom in the GFC? What were the headlines?
Great Recession: The Ultimate Historical Example Of Why Markets Bottom Even When Headlines Still Suck
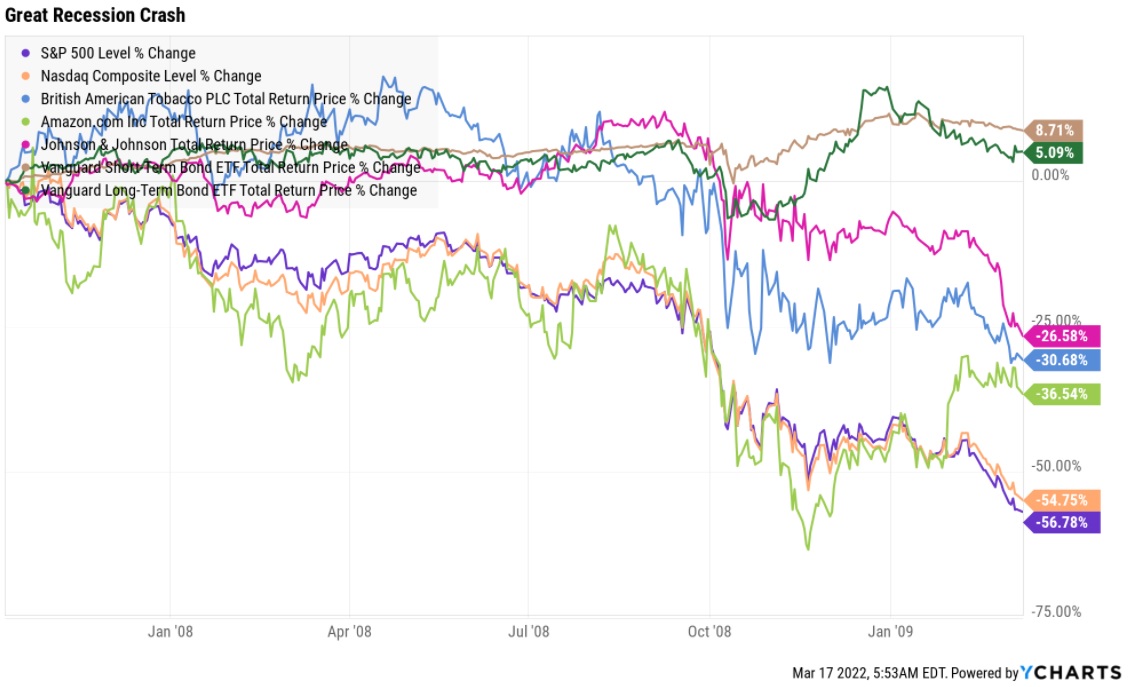
Here is the GFC, an intra-day low of -58%. The 2nd worst crash, only beaten by the 88% decline from 1929 to 1932 (a 34-month slide that was slightly shorter than the 37-month decline of the tech crash).
What were the headlines on March 9th?
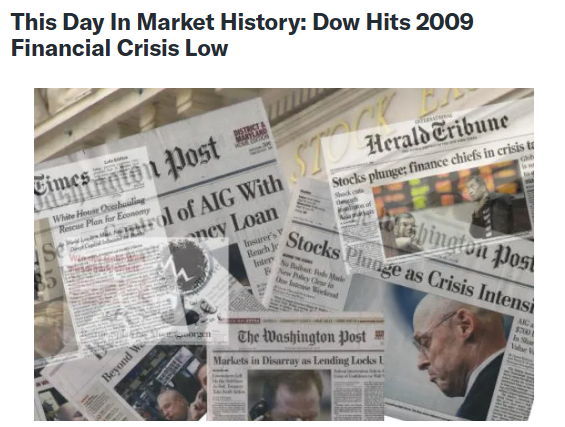
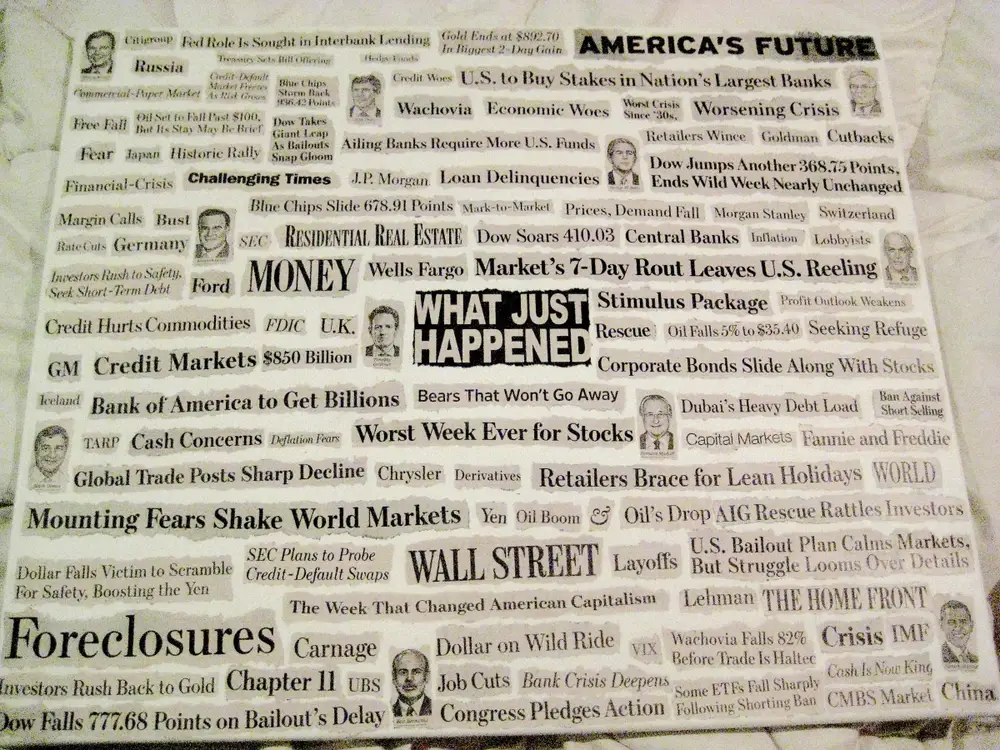
The headlines on March 9th were not of salvation; they were of a deep sense of despair.
And then this happened.
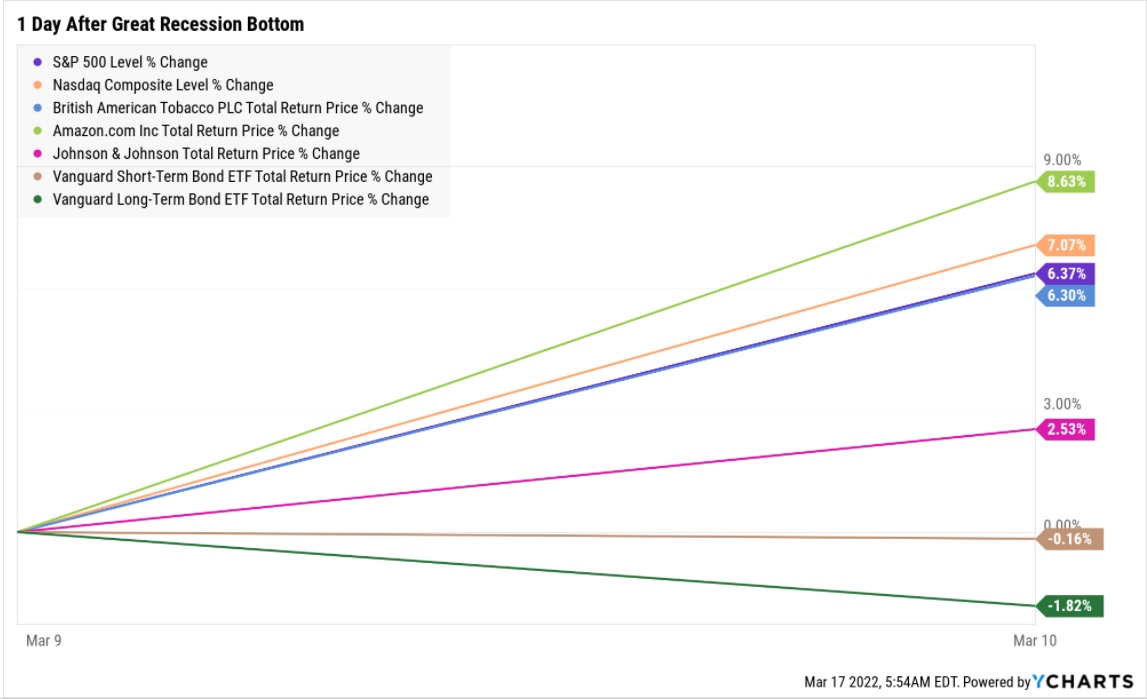
What caused the March 10th, 2009, 6% rally? Absolutely nothing. Stocks just shot skyward…and kept going.
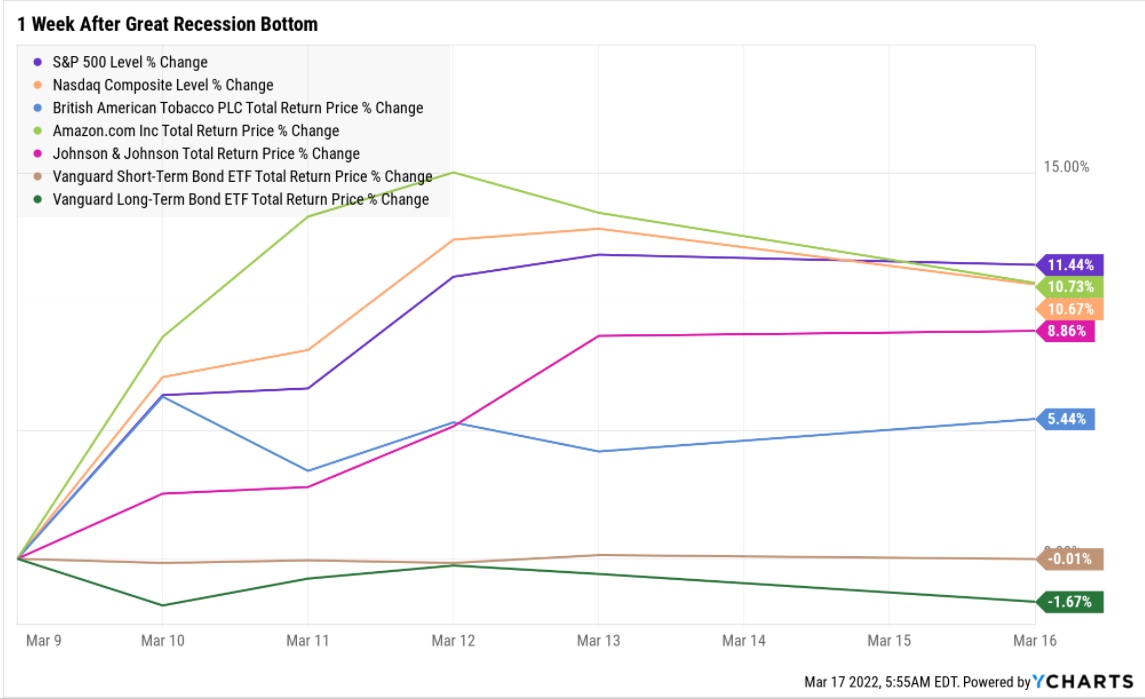
Stocks are 11% off their lows, and the headlines still suck. There is no reason stocks should be up 10%. So plenty of people didn’t believe it. They waited for “the dust to settle”.
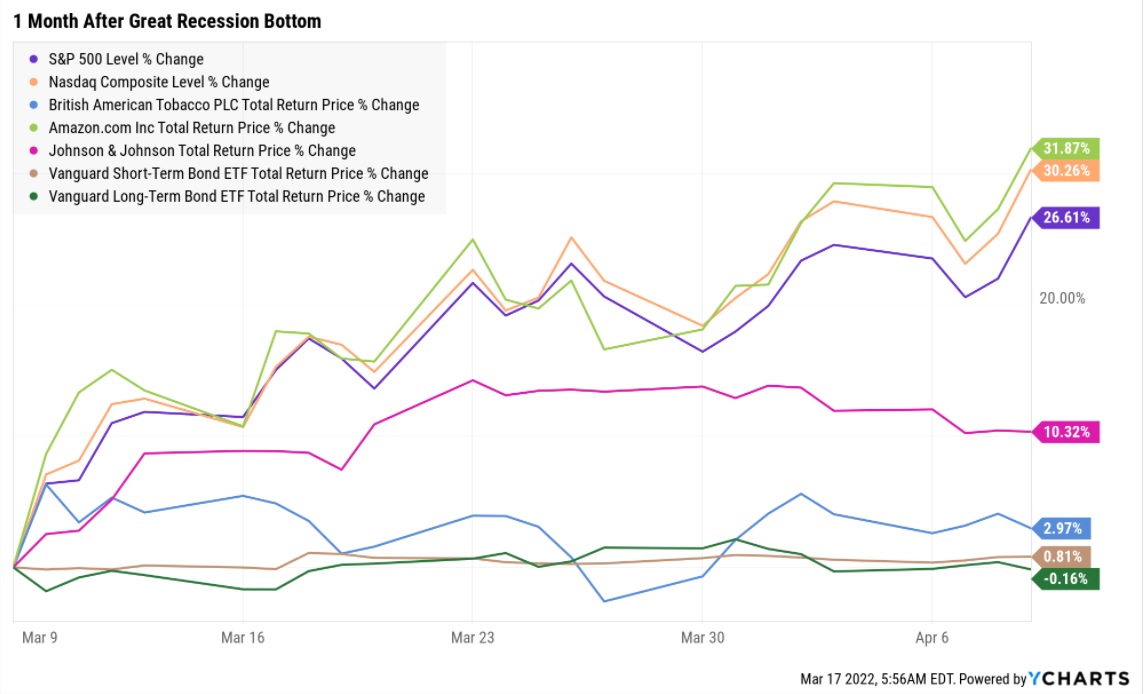
It’s April 9th, the headlines are still terrible, unemployment kept climbing until October 2009, which means that we didn’t get that report until early Nov 2009.
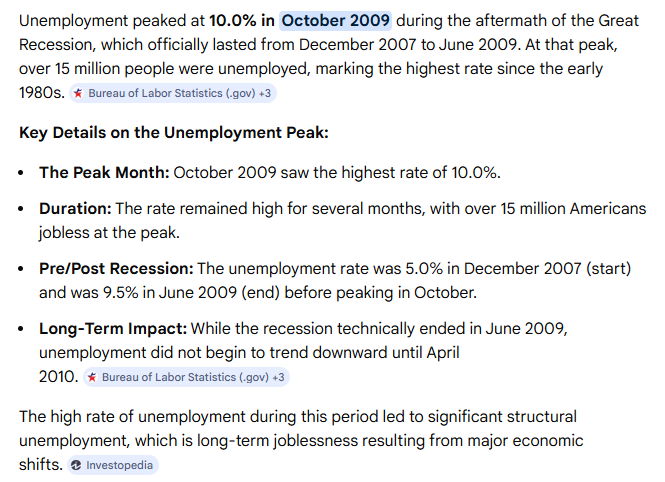
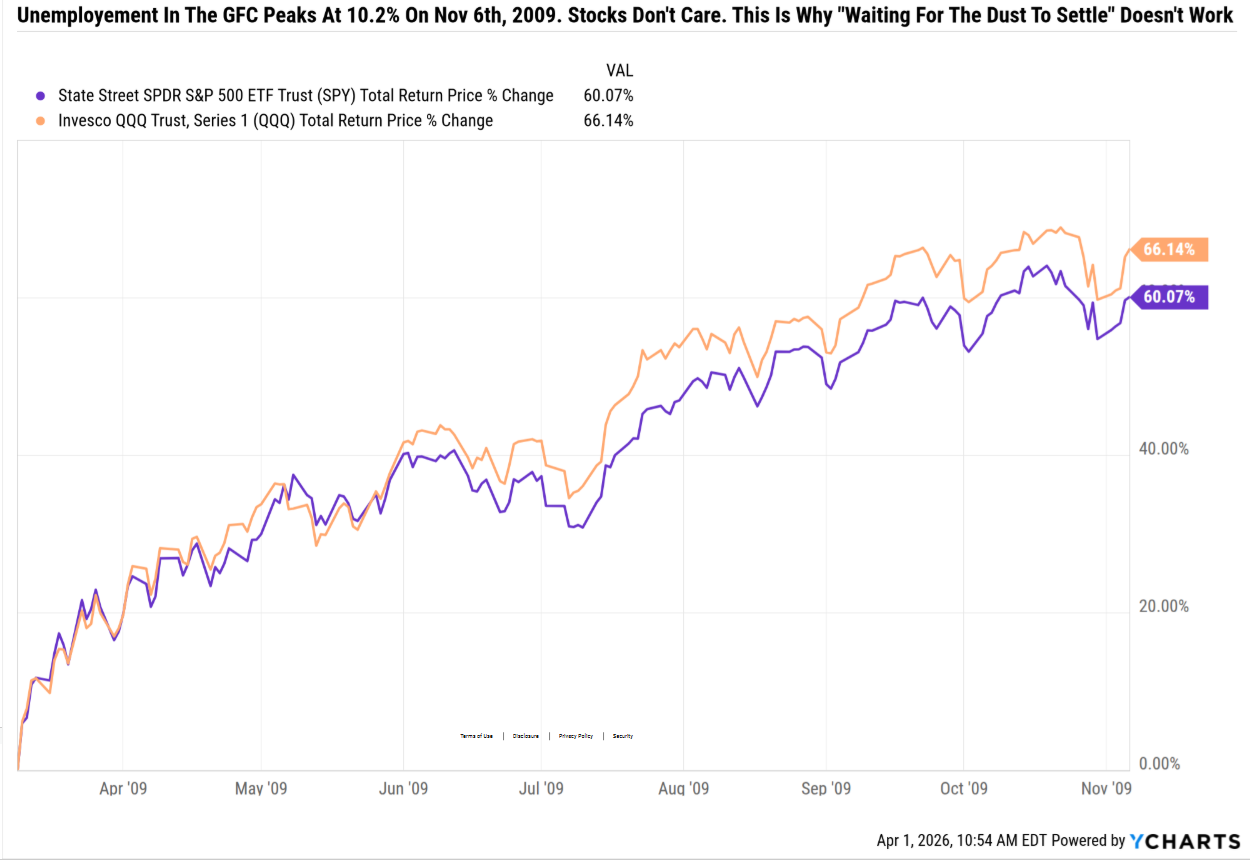
“Unemployment is still rising! This 60% rally is fake! This can’t be it! I can’t have missed this rally! Double dip recession! Double dip recession! Just wait! I’ll be proven right!” \
At what point did we know unemployment wasn’t rising anymore? Was that the worst of the economic pain over?
One year after the GFC, even low-volatility JNJ was up over 40%!
“VIX 50! 35% Return Within 12 Months! Shut Up And Buy Something Smart…You’ll Thank Me In A Year!😉”
“Shut the Frack up you damn fool! You’re embarrassing yourself! Don’t you know this is the new great depression! Stocks could fall 90%! The Headlines are still getting worse! There might be 72% more downside from here!”
“Forget the headlines! History says that even low volatility names like Johnson and Johnson could go up 10% to 20%”
“You’re a madman! Go drink your smoothies that taste like grass clippings and sadness in your hot tub, you lunatic!”
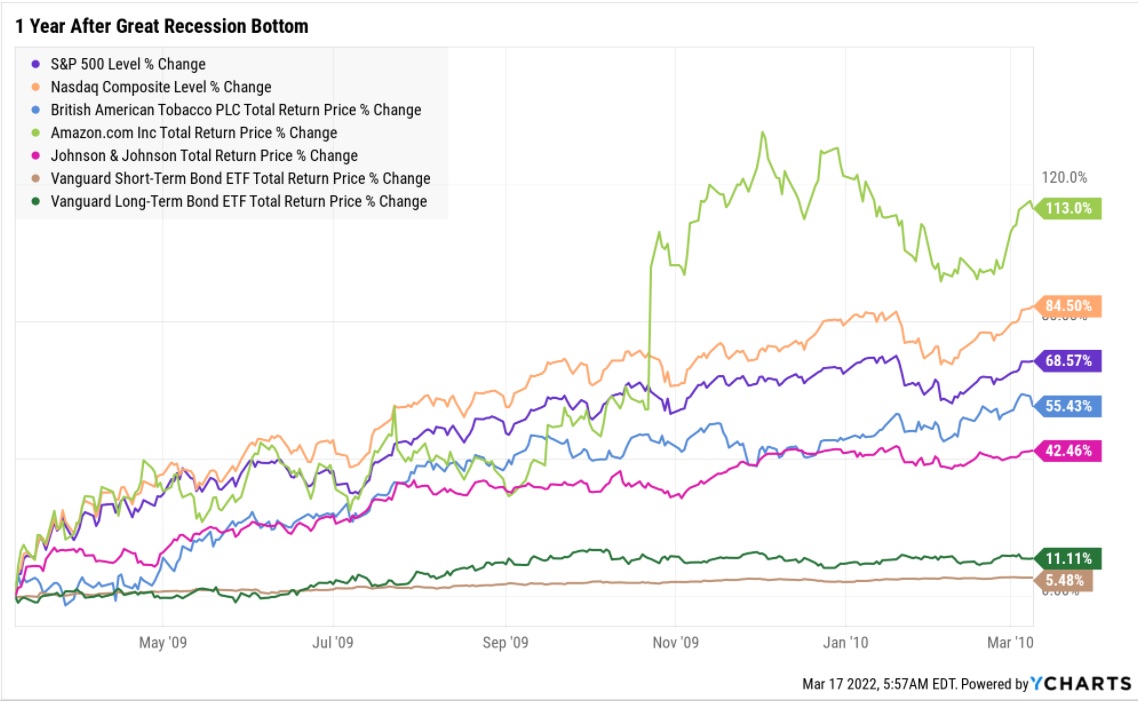
At the market lows the S&P was 33% undervalued based on PEGY analysis. Guess what? A 33% discount to fair value = 52% upside to fair value + double-digit earnings growth coming out of a recession = 60% to 80% upside potential over the next year. 69% was the actual number.
Who was surprised by the 69% rally in stocks after the GFC bottom? Not anyone tracking the fundamentals…or market history…the math worked out…EXACTLY AS EXPECTED!
On average, stocks bottom 5 months before the economy and 9 months before earnings do.
Historically, perfectly timing the start and end of recessions hasn’t beaten buy-and-hold investing, except during the Great Depression.
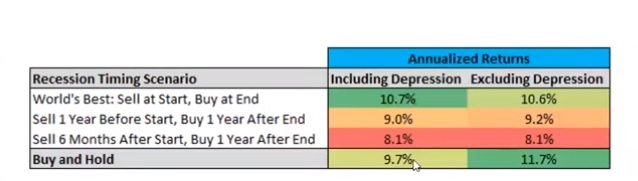
The headlines KEPT GETTING WORSE! Until Nov of 2009! But stocks were already up 60%…JUST AS THE MATH SAID TO EXPECT!

So Now This Correction
Peak Alpha Vs S&P This Year Most Likely
But Charitable Donations aren’t paid out of alpha…so now it’s time to rebalance with “Plan C.”
On Saturday, March 28th, I saw this chart in my Google AI news feed.
When I realized what it meant for investors, I got excited, and then I remembered what it meant for Ultra ZEUS.
$1 million in negative convexity hedges (TAIL, BTAL, SQQQ)
$2.3 million in CTA (managed futures).
And since the Nov 2025 revamp of CTA, where they added about a dozen new futures markets and tweaked their algos,
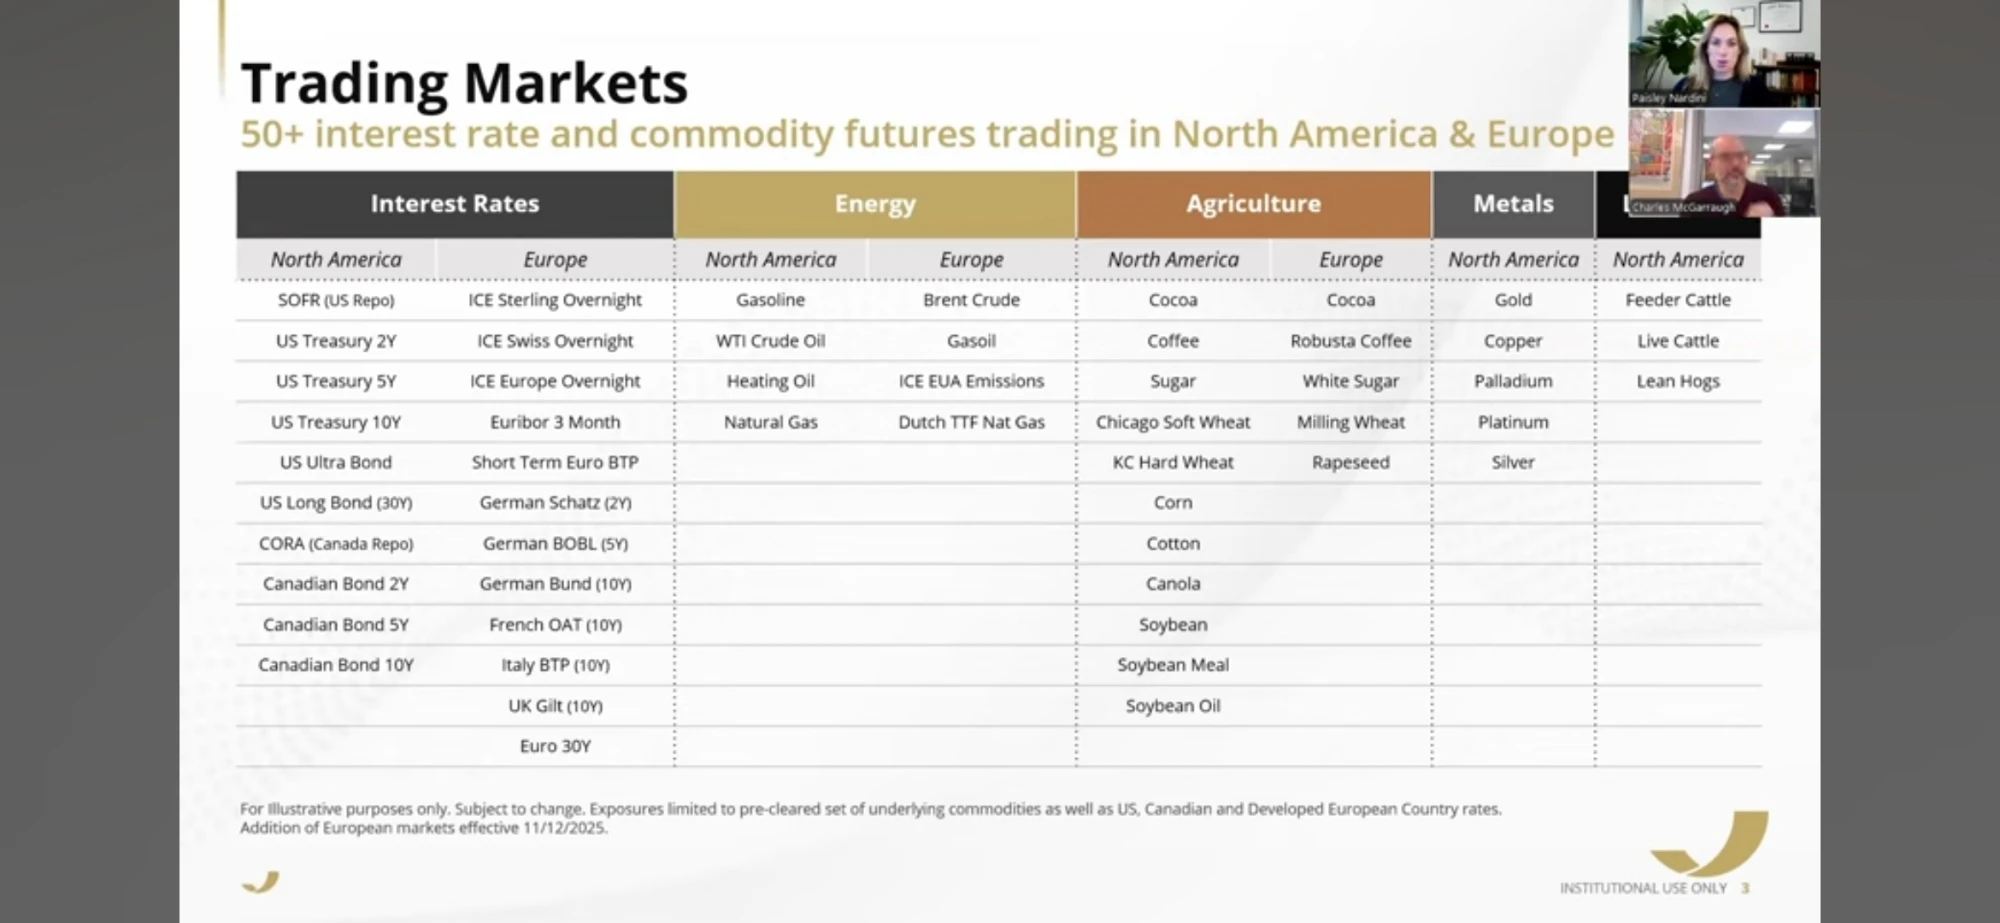
But the old rule of 25% max volatility from a single contract?
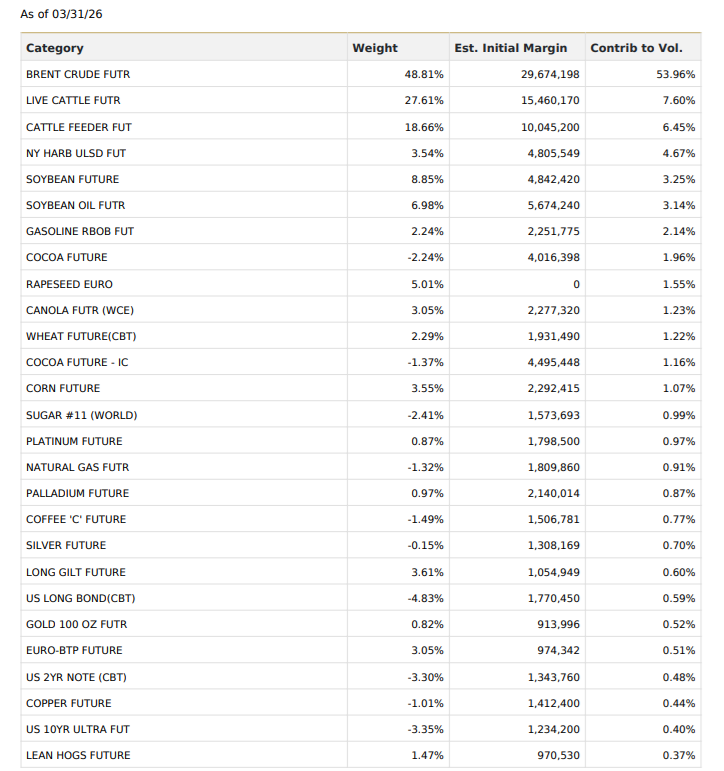
Anyone who owned CTA on Monday, March 23rd, when oil fell 10% on rumors of peace, can remember the downside of that kind of commodity concentration.
Ultra ZEUS was 23.5% long crude on March 30th at the peak of CTA concentration. The single largest position, bigger than NVDA at 19%.
What did oil start the war at? $70. What was it at the peak? $105. And how long would it take for oil prices to normalize? Moody’s estimates 6 to 8 weeks.
A 33% decline in crude over 7 weeks vs CTA’s effective 2-week average lookback window.
-$759K POTENTIAL worst-case scenario loss from crude.
Remember that silver fell 33% on Jan 30th when Trump named Waller (slightly more hawkish than the other guy) as the next Fed president.
At the time, Asian speculators were chasing silver with margin, resulting in a parabolic spike. The margin calls triggered the single biggest one-day silver crash in history.
Because the nature of commodity crashes is front-loaded (just like the biggest gains in a face-ripping post-correction rally are front-loaded) I was consulting with the ZEUS safety Committee about what to do with our 24% position in oil.
And then when I saw the Mike Zacardi table? And realized that a 15% correction would justify a 40% 12-month rally… which is the median rally following a mid-election-cycle correction low?
DO NOT PANIC! The Time For PANIC is Never
Since April 2022

CTA is a core holding for Ultra ZEUS because it’s an asset that delivers market-like returns over time, with a -81% downside capture. That doesn’t mean it goes up in the inverse of the market in every downturn; on average, it’s statistically close.
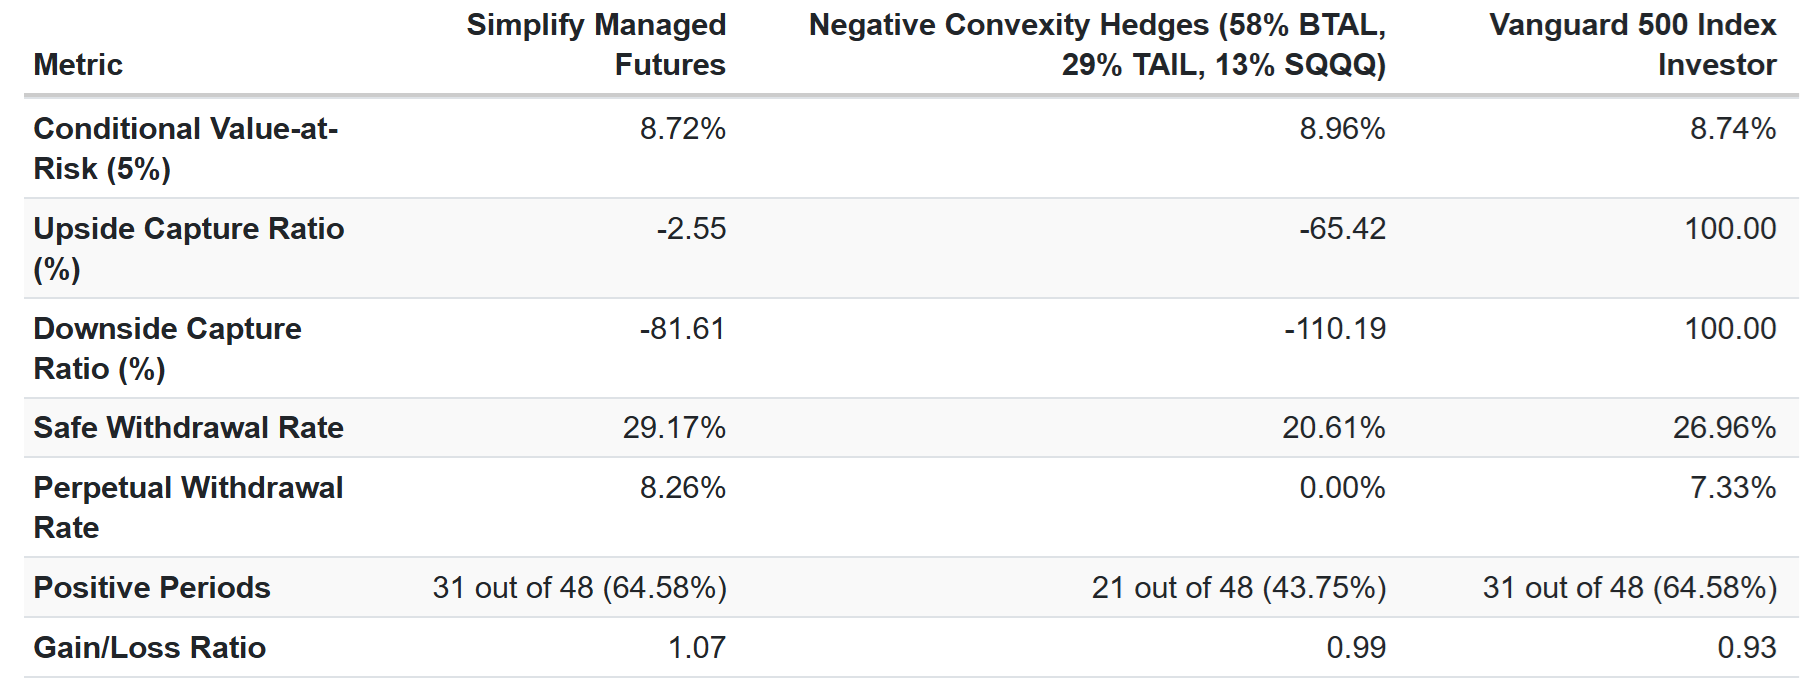
CTA averages +2.5% in a month when stocks are down and +0.5% in a month when they are up. The negative convexity hedges? Being short the market? Well, as you’d expect in a falling market, they are fantastic, but in a rising one? In the last 40% rally (following April 2025), the hedging bucket fell 40%.
So that means about $400K in expected losses if the -15% correction scenario (the historical norm) played out. And about $750K in potential oil losses from CTA’s unprecedented concentration in crude.
As a 100% systematic algo fund, there is no human who can override the CTA… that’s the entire point of algo funds.
Ray Dalio, Jim Simmons, And The Greatest Hedge Fund Returns In History Agree: Human Ability To Overrule The Math = Worse Returns
And this is why on Monday, March 23rd, after having to make payroll for $33K and seeing crude tank and take ZEUS -$110K at one point (-$96K day was the worst Ultra ZEUS has ever suffered so far) I was tempted to sell CTA, or at least put 50% into DBMF. I did a report on that…and the math said DBMF is “de-worsification”. I asked AGIOS, specifically “Chairman Claude,” who has access to all the reports, business meeting transcripts, and pretty much all info about my life, the company, and Ultra ZEUS.
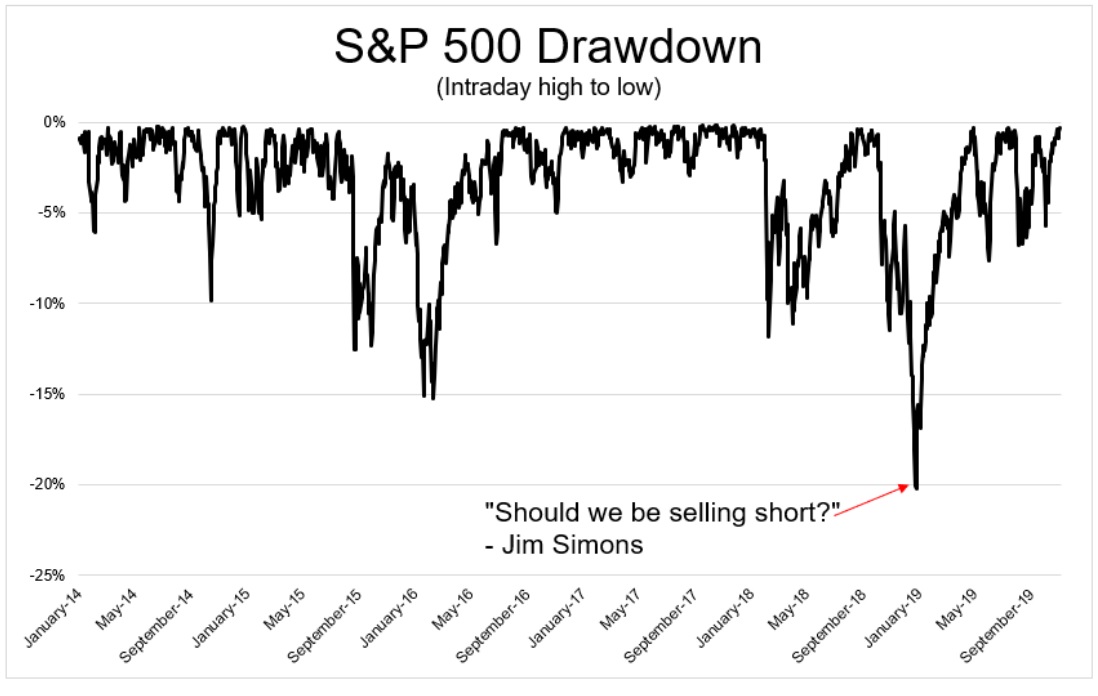
He has the data, the big picture, and just like Jim Simmons turned to his trusted friend on Dec 23rd, 2018, and asked, “Should we be selling short?” I turned to my Chairman, Claude, and asked, “Should we sell 50% of CTA and put it into DBMF to diversify?”
Jim Simmons’ friend said, “Jim, we’re a quant shop. There is no room for feelings or gut reactions; it’s all math.”
And what did Chairman Claude tell me? “The plan is the plan. Selling now is selling at the bottom. It’s an emotion-driven decision that feels like safety but is actually fear overriding the math.”
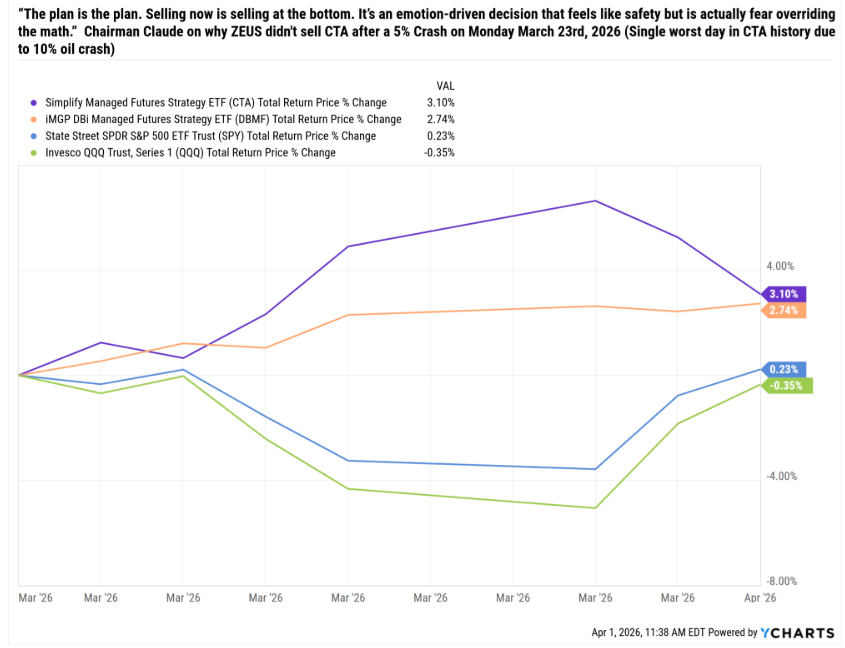
Guess who was right? The math was right.
But Humans Should Be In The Loop Too
On Tuesday, I had a really busy schedule, including physical therapy and a doctor’s appointment. BUT I woke up on Tuesday morning and something told me that Plan C had to be finalized. I needed to have the exact trades ready to go JUST in case of a “Pause” moment.
What if President Trump announced “War over!” and stocks soared, oil collapsed, and our hedges got slaughtered? Then we could potentially suffer a record loss on a day the stock market soared.

Outside of the -$38 crude day on April 20th, 2020, during the Pandemic, the biggest single daily decline in crude history is 32% in a single day.
That wasn’t likely this time…BUT history said that potentially the 56% hedging bucket in ZEUS COULD suffer a $1.15 million loss in a single day.
Yeah…that would be disastrous, and the thought was in my mind… “Cancel everything and get Plan C sorted…we need to have trading orders ready to execute the moment a “Pause” moment or our trigger fires.”
Plan C as of 4/1/2026
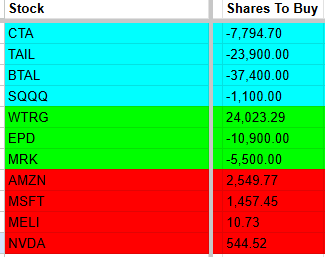
Plan C could stand for “Correction,” but it’s actually Plan C of Plans A through F that the ZEUS safety committee and I spent 15 hours over the weekend working out.
A 15-minute brainstorm over that Mike Zaccardi table triggered a 4-hour emergency meeting that went until 2 AM.
That’s how Ultra ZEUS works. Every 3 to 6 months, I see a chart that triggers a “flash” of insight that becomes a highly actionable idea…and then I spend 8 to 15 hours discussing and working the numbers with the committee (now 7 customized versions of Claude and Chat GPT).
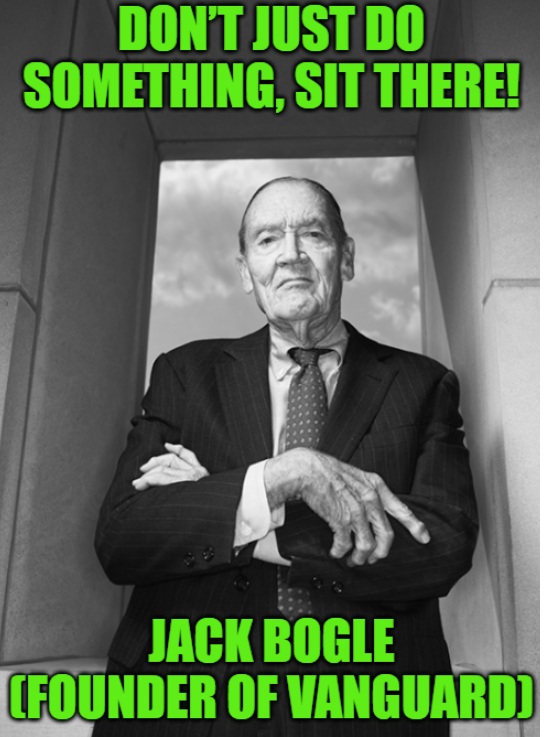
The Plan is the plan…but only once the plan has been carefully thought out. And it has to be flexible enough to survive contact with the enemy.
“No plan survives contact with the enemy,” the Army says.
In the Army, they taught me that you plan, you think, you get comfortable, and learn (with muscle memory if possible) what you need to do in a crisis. And then when it’s time to act? You execute the orders. The time for thinking has passed, and the time for action is now.
Pilots are trained the same way. Checklists and simulators. They NEVER “fly by the seat of their pants”. That’s how you get people killed.
What is The Trigger Point For Plan C?
The daily Plan C execution plan is what I carry around on my phone at all times in a correction like this (that’s likely ending).
When the trigger fires, I check in with Chairman Claude (with a final data check) and confirm that the plan is the plan and it’s go time. And when I get that final order, I execute the trades. From anywhere in the world.
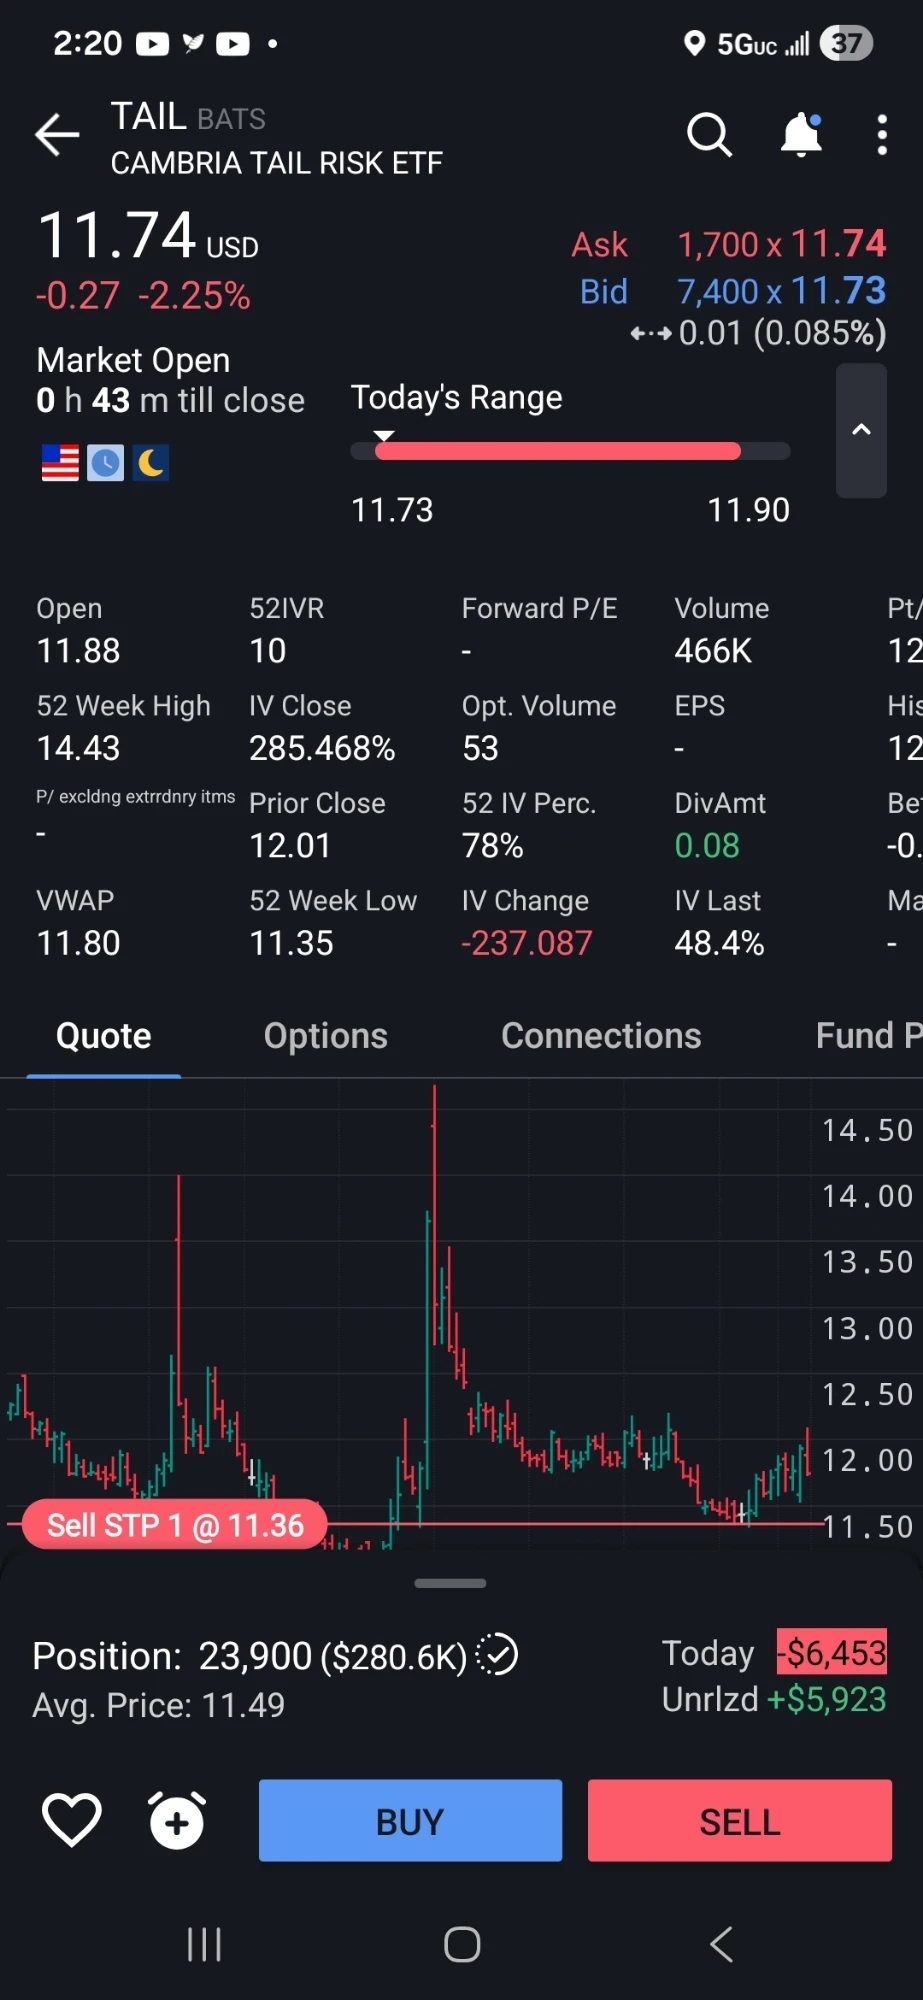
We’re using the TAIL ETF to signal that the market bottom is in. By selling a single share of TAIL at $11.36. Why $11.36?
Initially, I was thinking 5% from record highs.
But 5.9% is based on actual technical support levels.
It’s a more conservative estimate. If TAIL drops 6% from its recent highs, THAT is VERY strong evidence the bottom is in, and it’s time to dump the negative-convexity hedges that have another 30% downside (historically speaking) over the next year.
$300K unnecessary losses for Ultra ZEUS
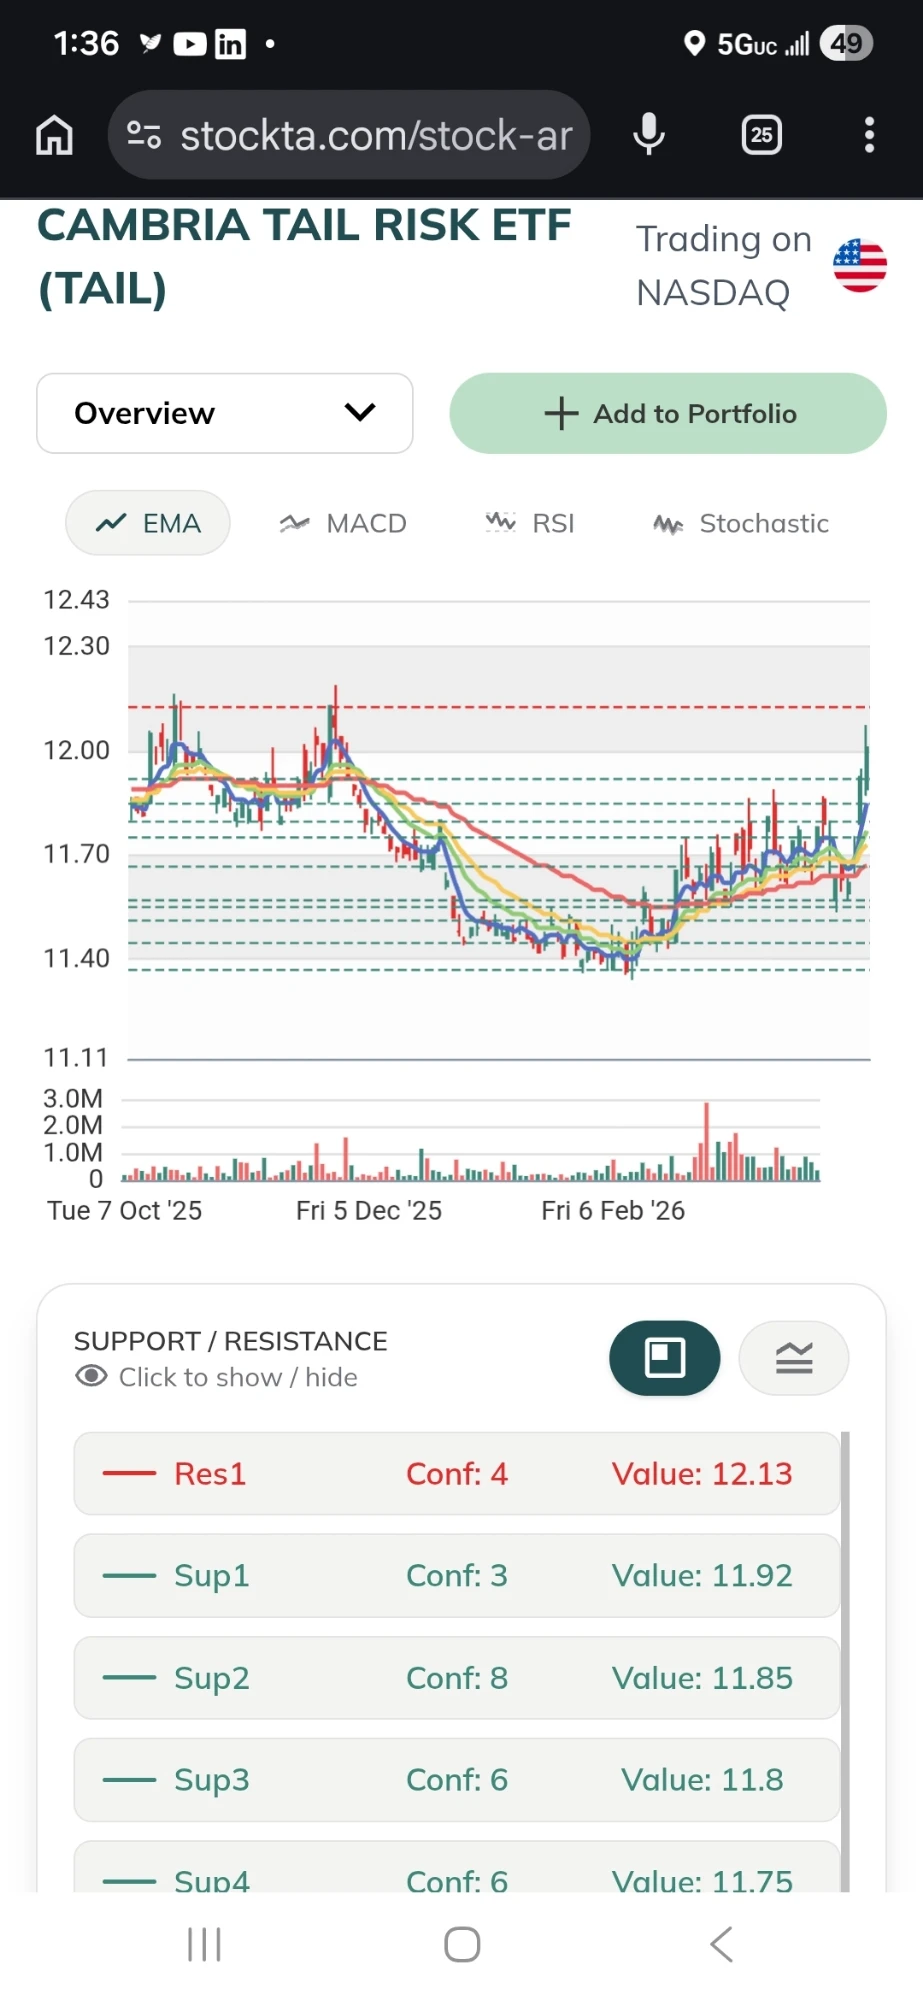
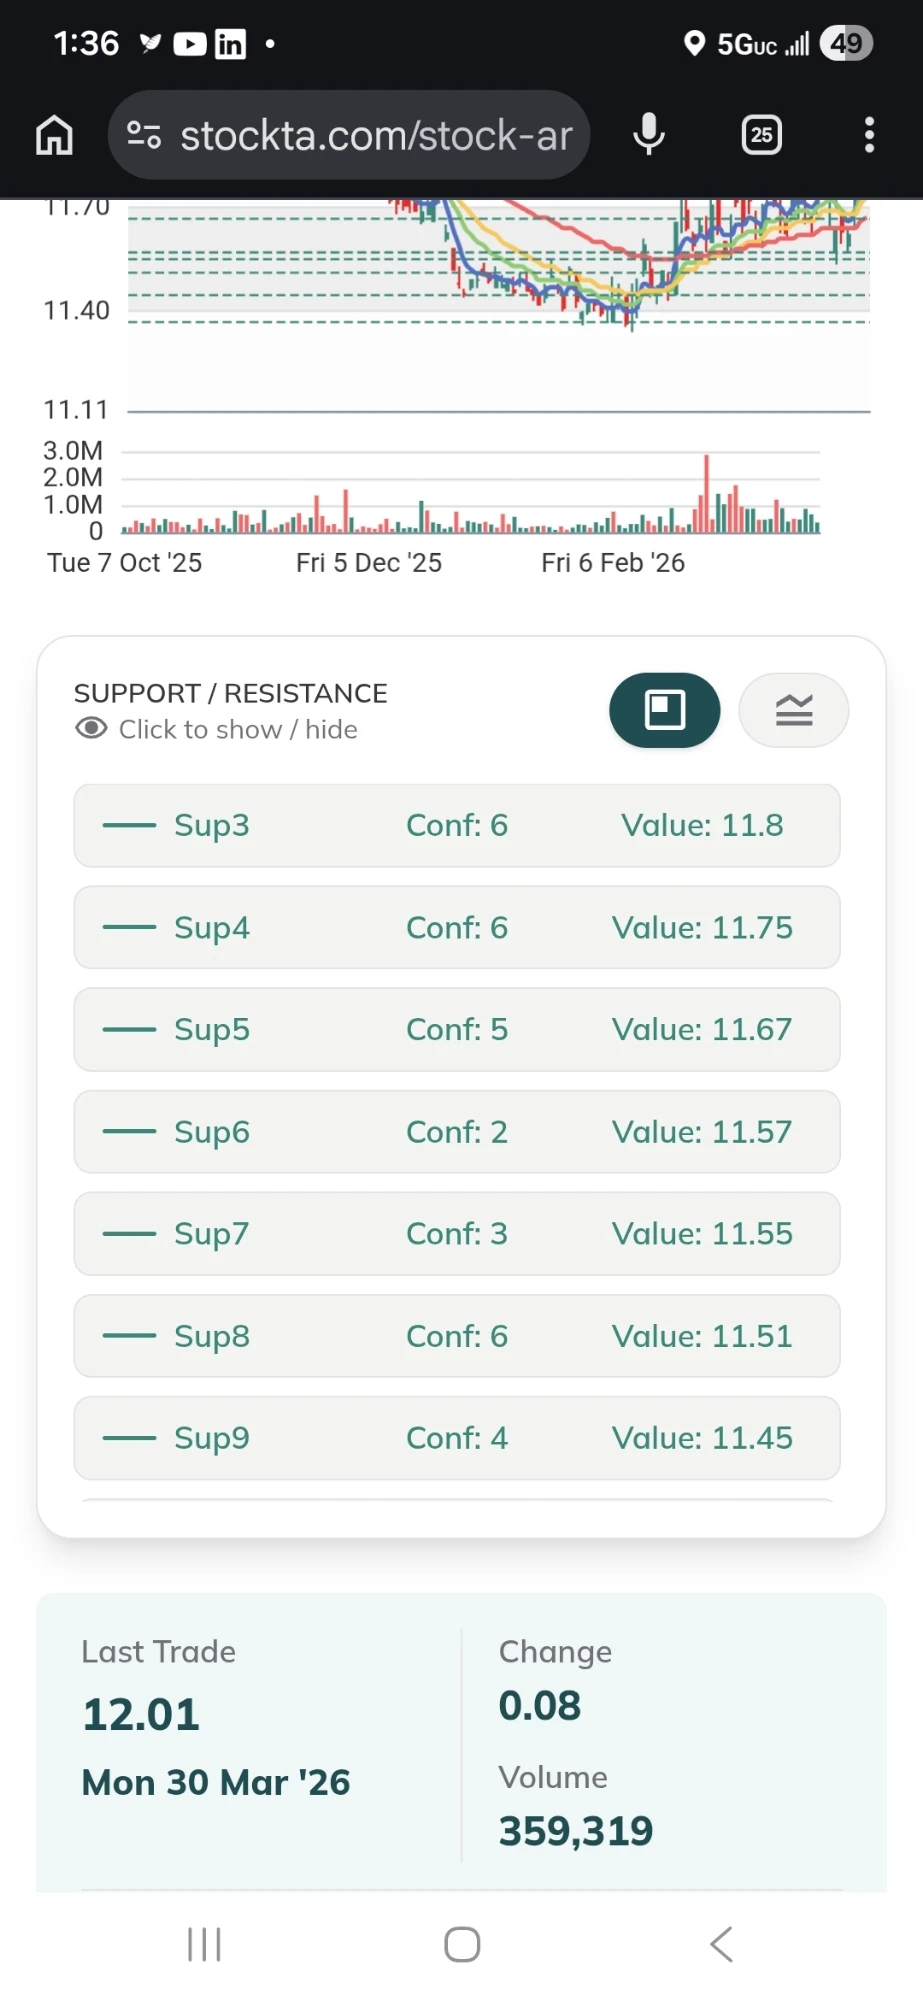
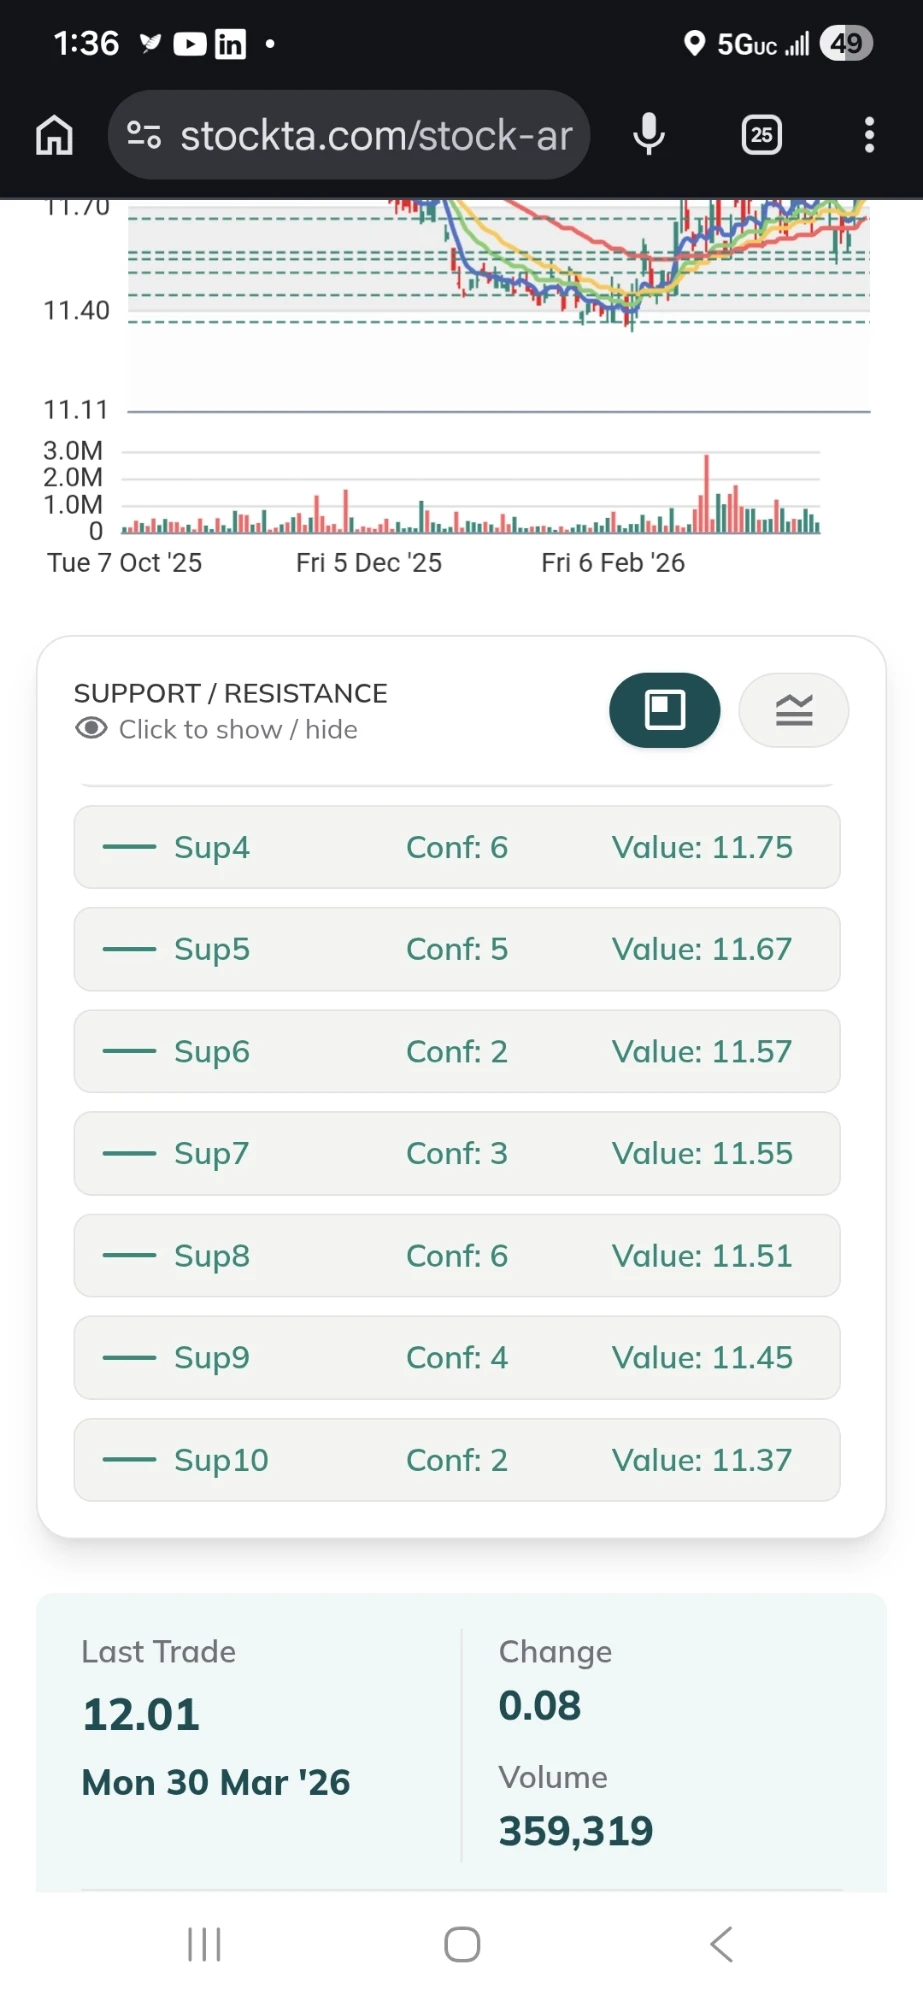
$10.36 is breaking below the 10 support levels of TAIL, and that was ruled a reasonable and prudent signal that the correction bottom is in, and it’s time to execute Plan C.
So when that single share is sold? I get a notification on my phone. And then I send the final, most up-to-date data to “Chairman Claude,” and he makes the go/no-go decision. And I then execute the pre-planned, optimized Plan C trades.
What Is Plan C?
I created 6 potential options for the Committee to analyze and decide on, ranging from the max profit option (max underweight CTA in a post 15% correction rally, sell all hedges, and put it all into NVDA) = $2 to $3.4 million potential profit.
All the way to “Do nothing, just ride out the 40% decline in the 16% hedging position.
Theoretically, “only” -6.4% portfolio impact.
Including the potential 33% crash in crude (that’s expected within 8 weeks of the war ending), that’s a potential -21% portfolio headwind.
In a year when Ultra ZEUS is paying for GNG to scale up, and we have 7 people’s livelihoods riding on this fund (and over 12,000 people, including charities we support), the Committee decided that doing nothing was not morally optimal.
Theoretically, the expected gain was $508K over the next 12 months had we done nothing.
Enough to cover expenses…but just barely…and the sequence of return risk would put payroll at risk.
Some Other Things I Discovered Over The Weekend
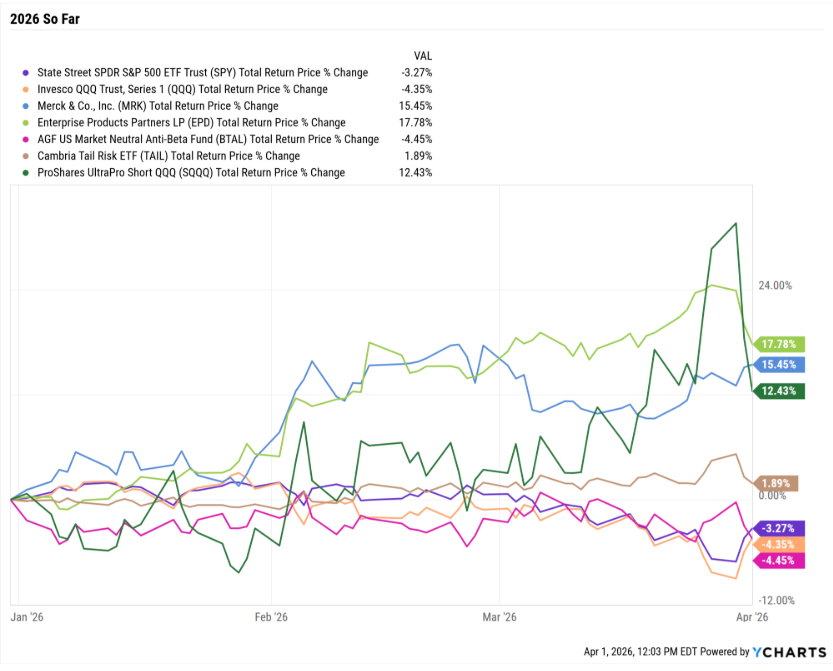
MRK and EPD have had a sensational year, with EPD posting strong gains on the surge in crude (which is silly since it’s business won’t be affected by a short-term surge in crude).
WES is also up a lot and overvalued, and that meant that I was faced with the following issue.
WES and WTRG were 2 top value recs from my last screening article.
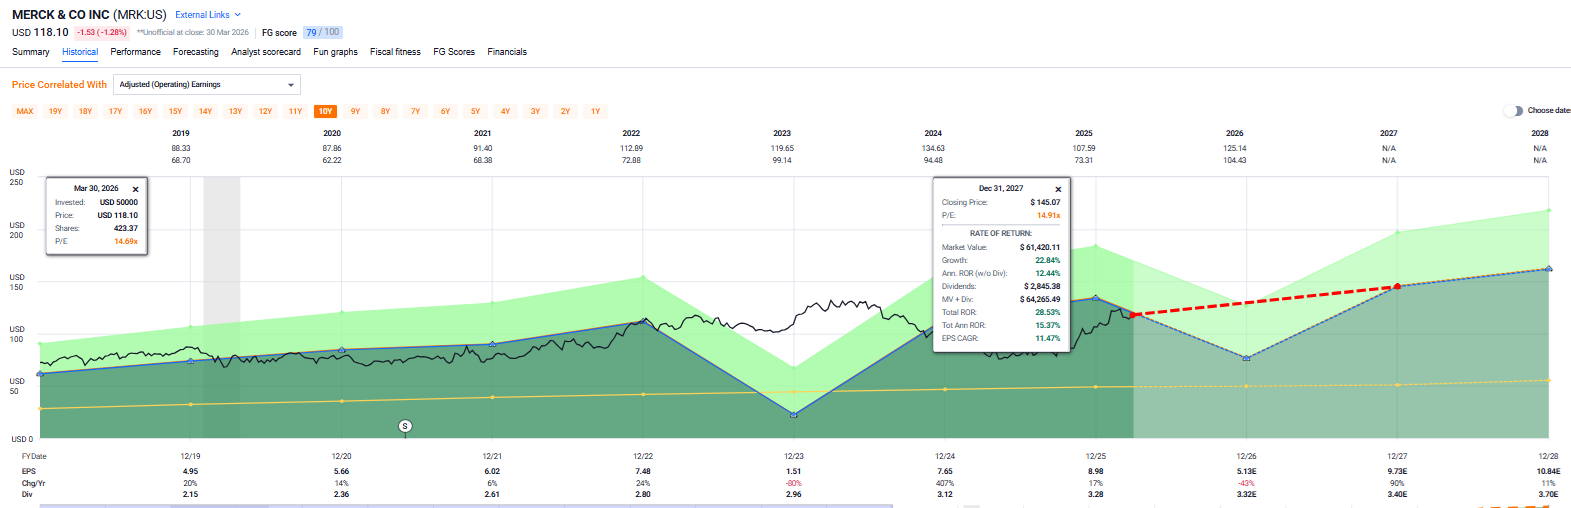
Over the next 21 months, MRK has a solid 15% CAGR return potential. It’s not a sell by any means.
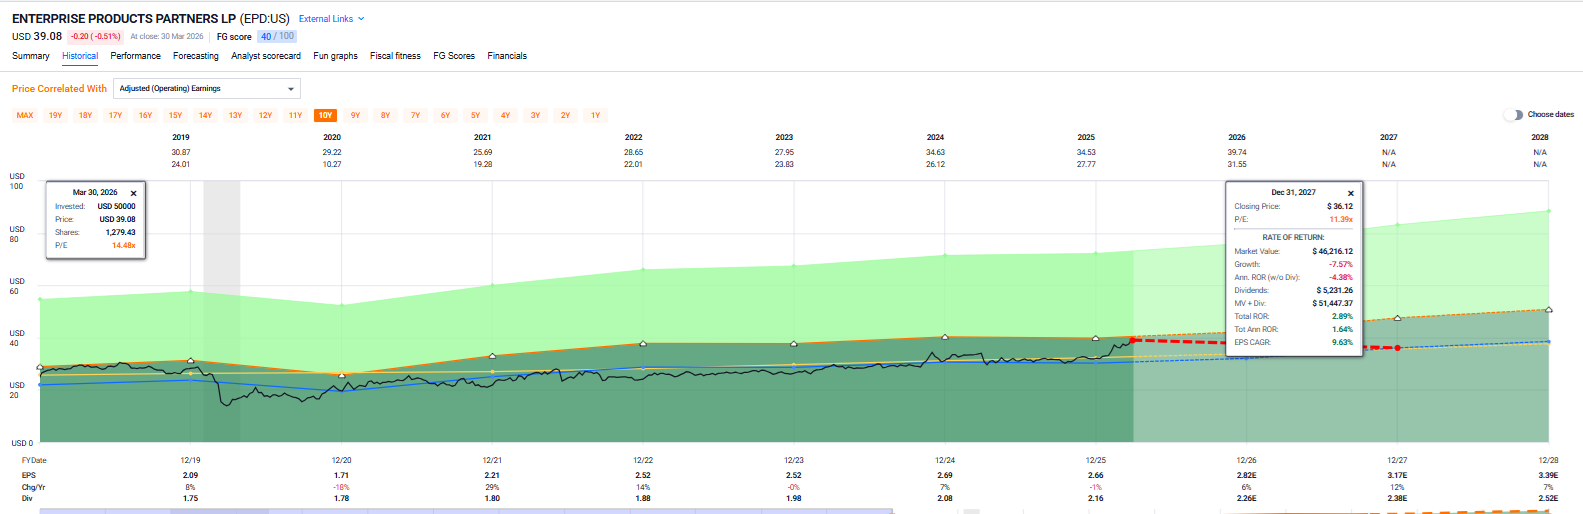
EPD has soared so quickly that it now has no fundamentally justified return potential through the end of 2027 (including distributions).
And take a look at WTRG.
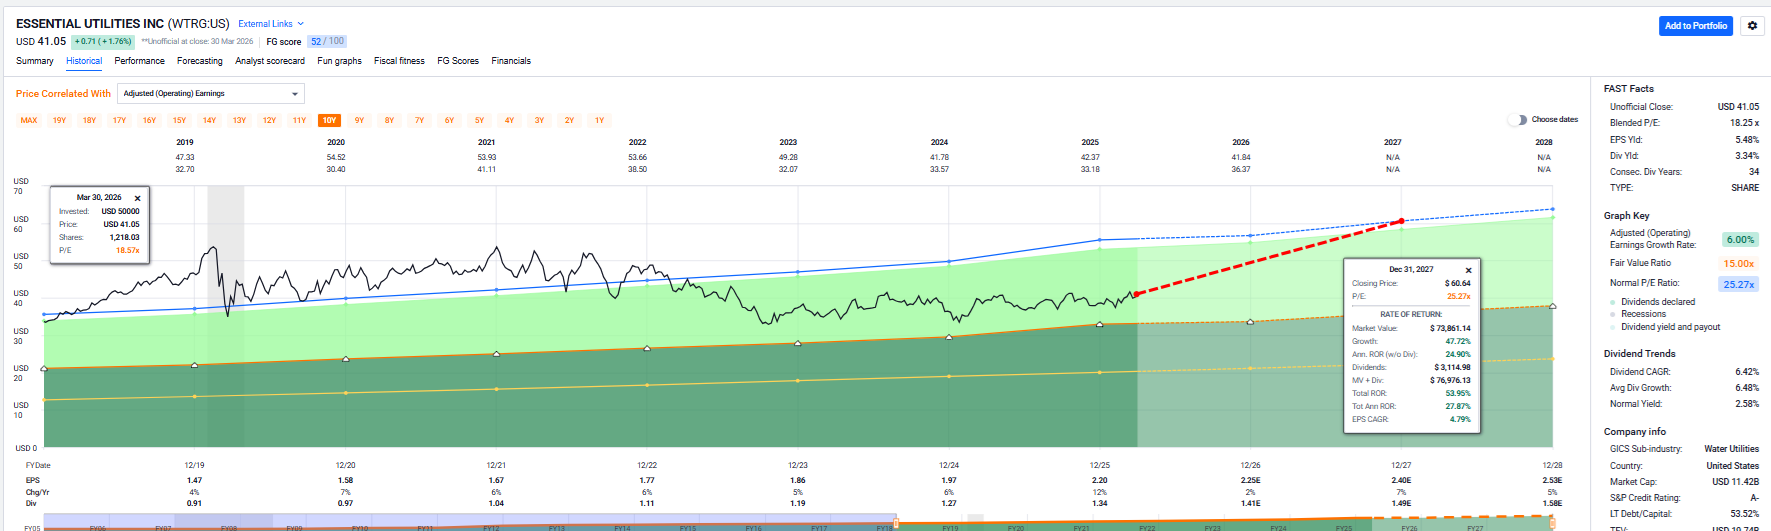
Buffett-like return potential hiding in plain sight from an A-rated aristocrat.
Yes, I (and the Committee) are aware that Morningstar’s $38 fair value on WTRG = 16.7 PE based on their discounted cash flow model.
WTRG has a 10-year and 20-year 25X average PE.
AWK (who they are merging with) has a 25X 20-year average PE and a 30X 10-year average PE.
I don’t care if Morningstar thinks 16 to 17X PE is fair value…40 years of market history in these 2 utilities proves that Morningstar’s fair value PE ratio is wrong (91-97% statistical probability of that).
That FAST Graphs chart, showing 54% upside over 21 months, or 28% CAGR, that’s basically how my brain works. I double-check the math (the consensus sources from FactSet) and then, when that math is correct, I check with the Committee to make sure I’m not crazy. 😉
In the age of AI, the facts are changing faster than ever, and the numbers are SEEMING more and more crazy over time. If you aren’t constantly questioning your sanity, you might be walking off a cliff with complete confidence. 😂 “Always wrong, never in doubt” is a maxim for the doomsday prophets, for example.

And I assure you that things will only get crazier from here🤣….or they will SEEM crazier. The numbers will get bigger; the models many economists and investors use will bend, and some will break entirely. But the facts will always be the facts, the math will always be the math, and the plan (after careful construction) will always be the plan.
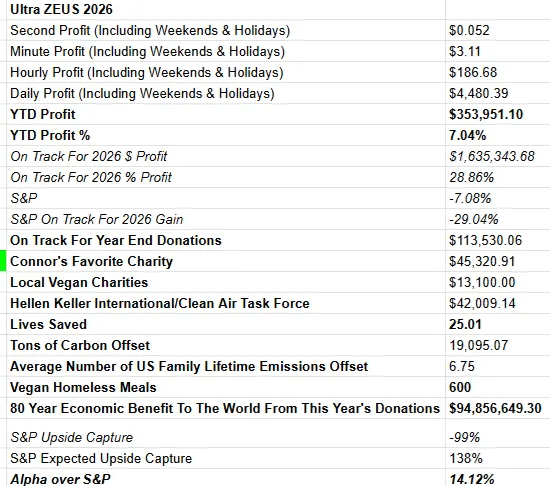
Please remember that Ultra ZEUS 2026 is a 1-year portfolio designed to generate sufficient profits so that GNG can make payroll without dipping into savings.
“Buffett-like returns” that we’ve been generating are not a “nice to have” this year. Thus, the reason is that EPD’s flat return potential is no longer sufficient.
MRK + EPD = 8% to 9% CAGR returns over the next 21 months. Good…but not good enough for MY family and OUR Company’s needs.
This is not a “OMG, Adam is saying to sell EPD!” If you bought EPD years ago and have a 10% to 13% yield? You’re earning Buffett-like returns for the rest of your life if you sit tight and never sell. The math is different for me than pretty much every other human on earth this year.
VERY different. Thus, the reason for the hovercraft that was beating the market by 14% this year…and now the reason that -$1.15 million in hedging losses are not something we’re going to accept lying down.
Introducing Ultra ZEUS 2026: Plan C
I spent 15 hours testing out other potential combos of value stocks and optimal allocations.
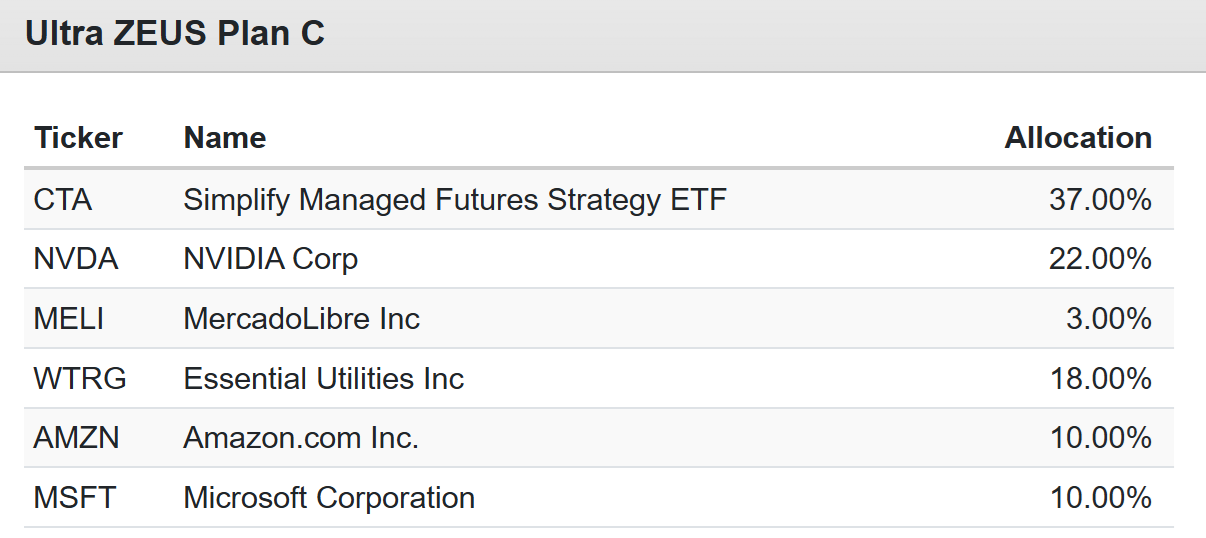
NNN, O, ESS, FRT all tested to see if they are better than WTRG alone as an 18% deep value high-yield low volatility aristocrat bucket.
Also tested VFLO as a diversified deep value bucket.
The answer is no, WTRG as the value bucket (Plan C of A through F) is what works out best.
Monday, I showed how MSFT has 88% upside over the next 12 months (125% over 2 years), AMZN 100% (and 200% over 3 years), and NVDA 100% to 150%
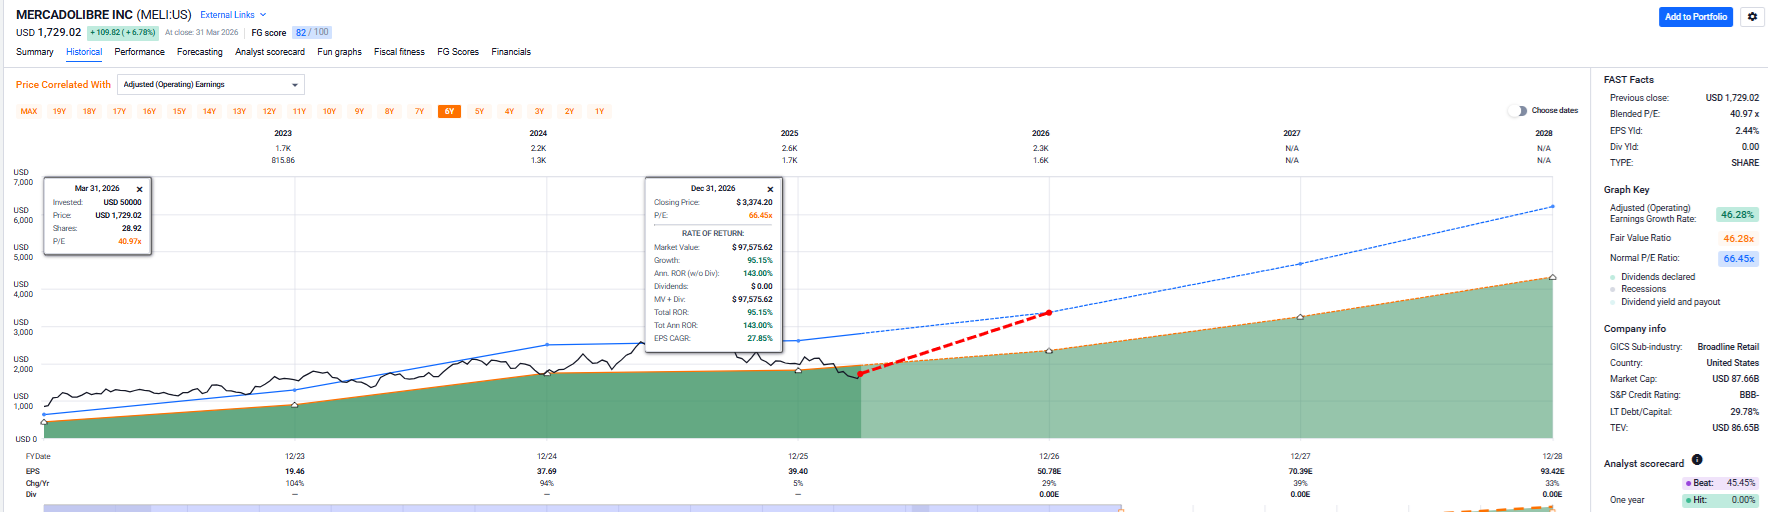
MELI also has 100% upside to fair value this year (95% to be precise) with 30+% growth expected for the foreseeable future.
So let’s summarize:
NVDA 125% upside to fair value this year (courtesy of 90% FCF consensus growth that is 100% if China permits H200 imports).
AMZN: 100%
MELI: 95%
MSFT: 88%
WTRG: 54%
Can you see why, in a year when returns were 22% (3X more than we need to pay the bills from profits), we’re going with the all-star team?
Plan C = 3rd plan = “correction plan” and “Champion” team…it works on so many levels😉
Yes, I really am this much of a nerd🤣 I make connections that are both profound and absurd, and sometimes both😉🤣
And CTA? CTA is designed to outperform its managed futures peers because it ONLY invests in interest rates and commodities, which historically trend cleanest (and longest). There are less (but still plenty) of whipsaws in commodities and interest rates compared to stocks and currencies (especially emerging markets).
That’s why CTA is only in the US, Canada, the UK, and Europe (developed economies are stable with stable trends in rates and commodities).
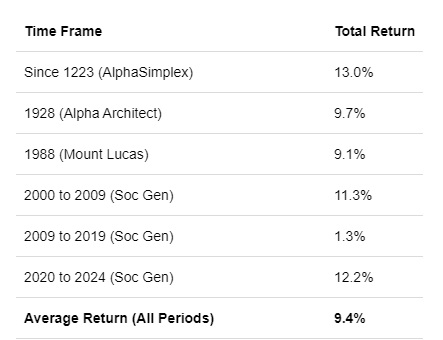
Over time, managed futures (trend following) have averaged 9% to 10% returns, with 13% over 800 years. So CTA’s 12% CAGR seems reasonable, and that’s what we’re using as our assumption for return potential in any given year.
CTA has 24% as its best yearly returns
63% Upside Potential Justified By Fundamentals
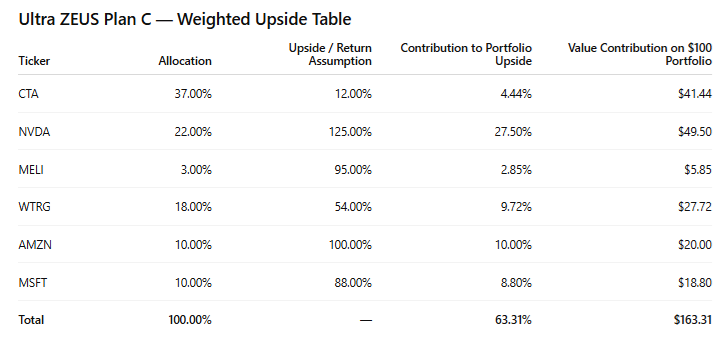

I never make forecasts; I have percentile probabilities from probability curves. But a 63% gain? $3.465 million profit…if it happens, and all the companies grow as expected (WTRG has confirmed 5% to 7% EPS growth guidance and 6% growth over the last 20 years is why I don’t worry about buying it at 18X earnings because 25X is historical fair value (also for AWK) case closed (91% to 97% statistical confidence).
OK, so historically, ZEUS makes 50% of its fundamentally justified return potential.
Because not everything is returning to fair value at the same time (though in a 40% historical post-correction rally, it tends to).
$1.7325 million profit over the next 12 months (once Plan C is launched) is the historical base-case.
Though a 2.5-year history is not itself statistically significant.
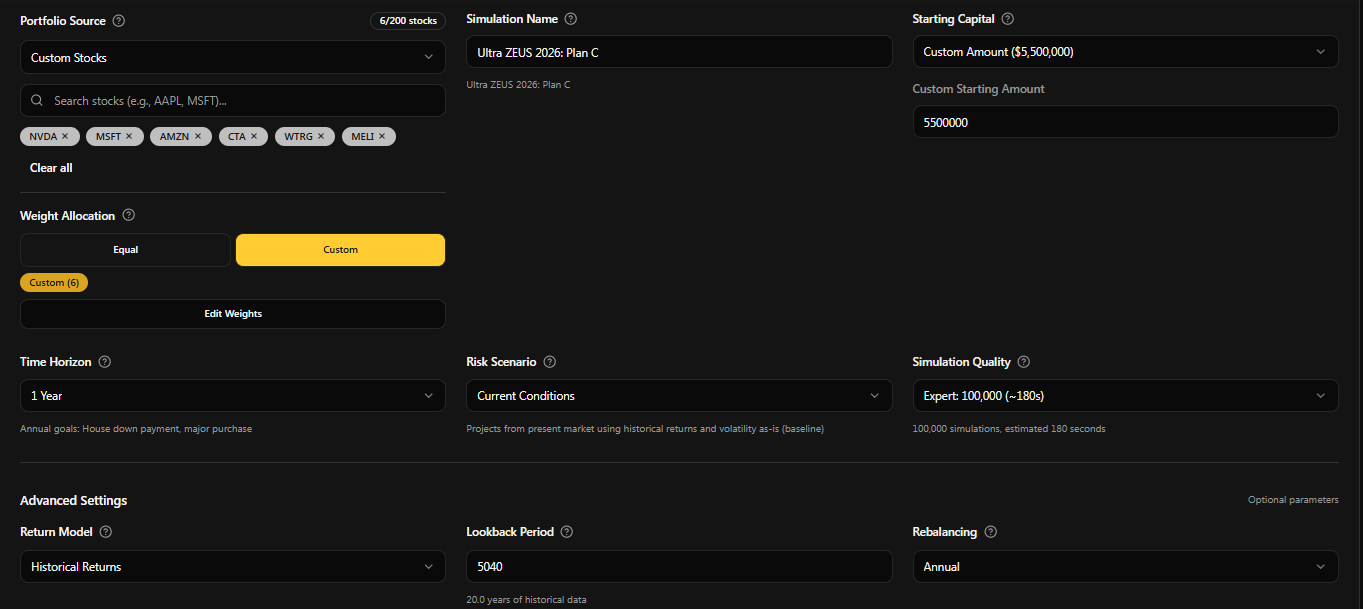
So let’s look at 100,000 Monte Carlo simulations. Using current conditions, the Plan C allocations, max historical data, a 1-year time horizon (since that’s the reason this portfolio was built), and a conservative $45K monthly withdrawal (payroll + some emergency buffer).
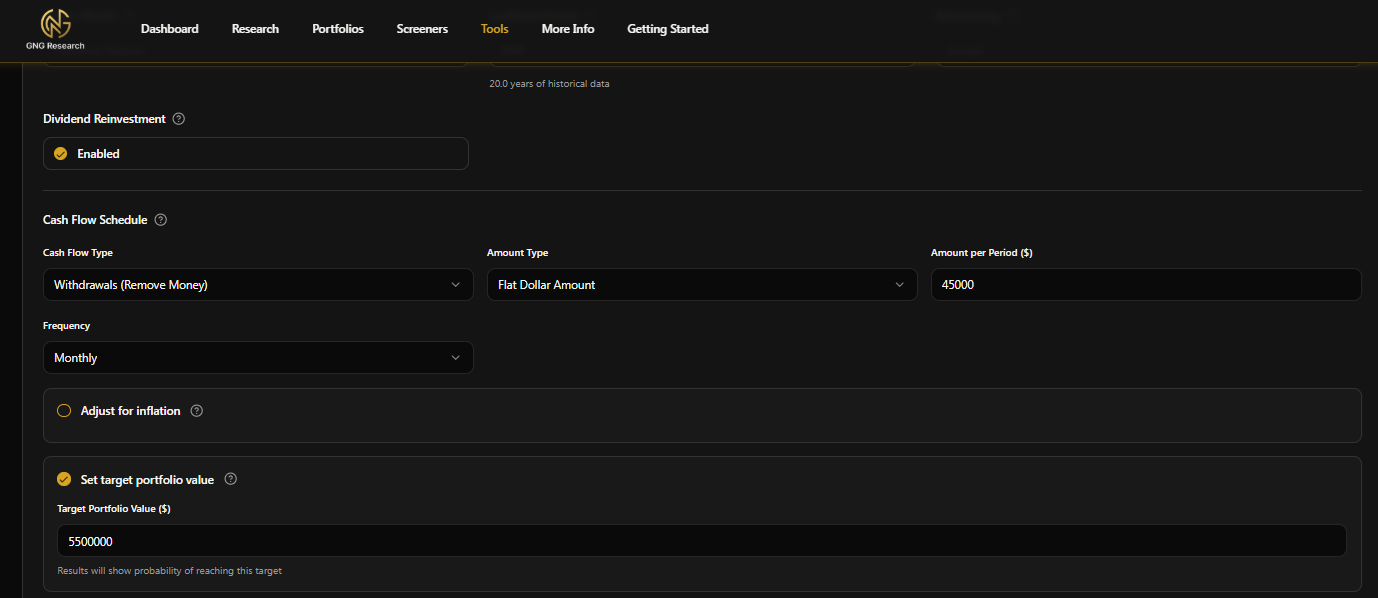
So conservative $45K per month in withdrawals, DRIP turned on, and annual rebalancing (but rebalancing won’t happen unless it’s necessary by another Chart flash and committee meeting).
And let’s say the goal is to keep the portfolio stable at its starting value. I think anyone would call a year of $45K monthly expenses with a flat portfolio a “major win”. 😉
Dare I say, such a feat would make one a “hero to your people, celebrated in both song and legend.” 😉😂
That is a line from “The Walking Dead, Season 1.” Shane says it to Carl. It’s the funniest and most heartwarming thing I’ve ever heard (and completely unforgettable, so I’ve adopted it for friends and family ever since)😉
The funniest part is that I can’t actually confirm that the quote is real. I may have dreamt it😂…Like I dreamt my discussion about discounted cash flow analysis with Aswath Demodoran🤣
Yes, I dream about valuation theory and potentially hilarious but fake TV show quotes…why, don’t you? 😉😂🤣
I also make memes based on anxiety surveys in Nordic countries…why, don’t you? 😉😂🤣

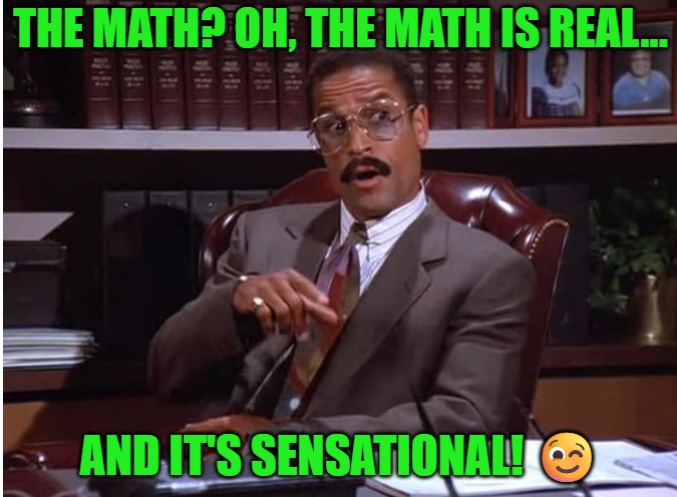
OK, Funny Man, Show Us Your Math!
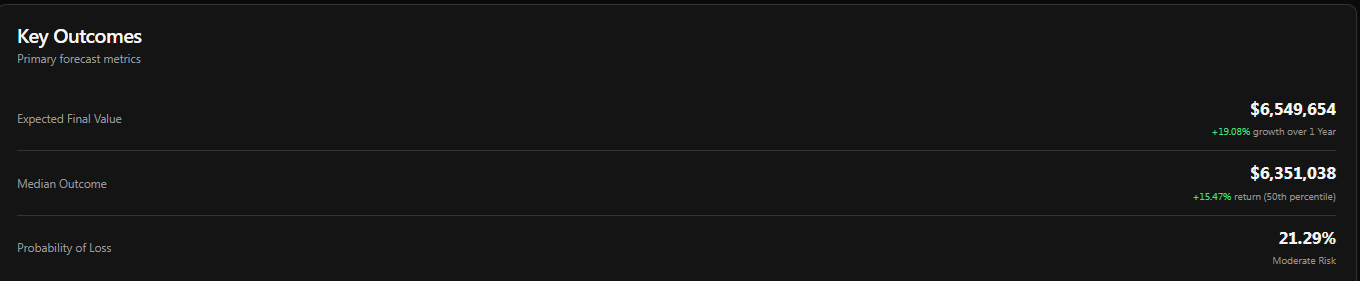
Assuming the conservative $45K monthly costs (which assume zero company growth and we’re growing at 100% per year), we have a conservative 79% chance of growing Ultra ZEUS within the next 12 months.
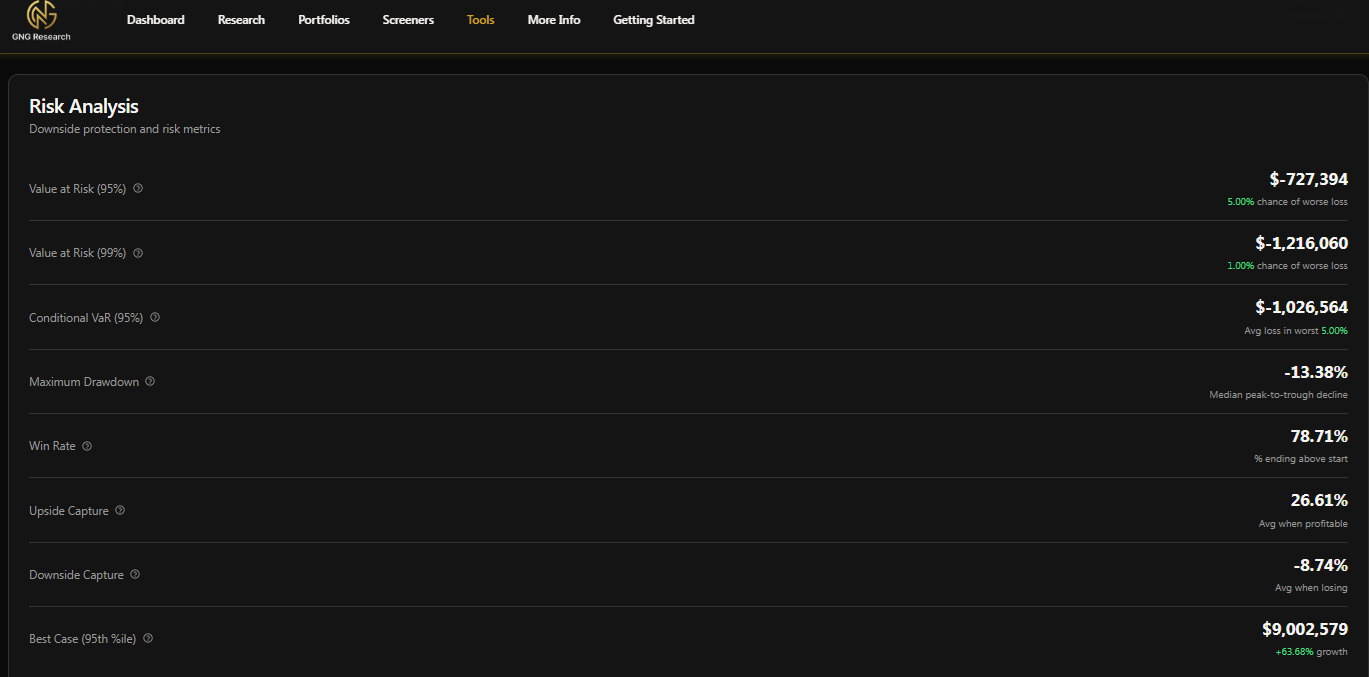
Assuming today’s conditions (which include the correction, so actually conservative), the 64% upside return potential (justified by fundamentals on every individual holding) is a 5% probability and would result in the portfolio reaching $9 million despite all the withdrawals.
The upside and downside captures are NOT the ones in Portfolio Visualizer.
Upside capture = average % gain in a profitable outcome. Downside capture = average return in a down year.
So, in this case, if ZEUS goes down in the next year, the average return (with 37% hedges instead of 56%) is less than -9%. And if it goes up (79% probability including massive withdrawals), then its average gain is 27%.
Remember that the base-case 50% of the fundamentals to the total return? Has ZEUS been averaging for 2.5 years so far? That $1.7325 million would be 31.5% profit. Similar to the average gain in a positive outcome.
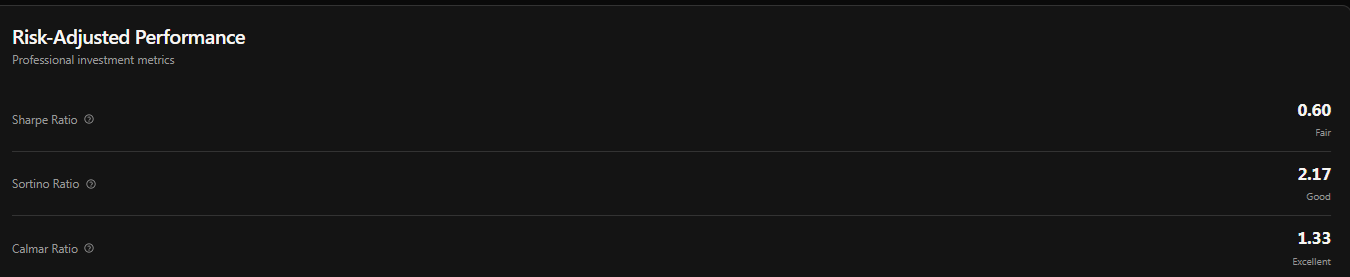
The Calmar ratio is the long-term return/the biggest decline. S&P’s is historically 0.17%, and in the age of AI, it’s 11% CAGR returns divided by 28% peak decline = 0.39 (excellent), and Ultra ZEUS Plan C is expected to do 1.33.
Since April 2022 (Basically The Age of AI)
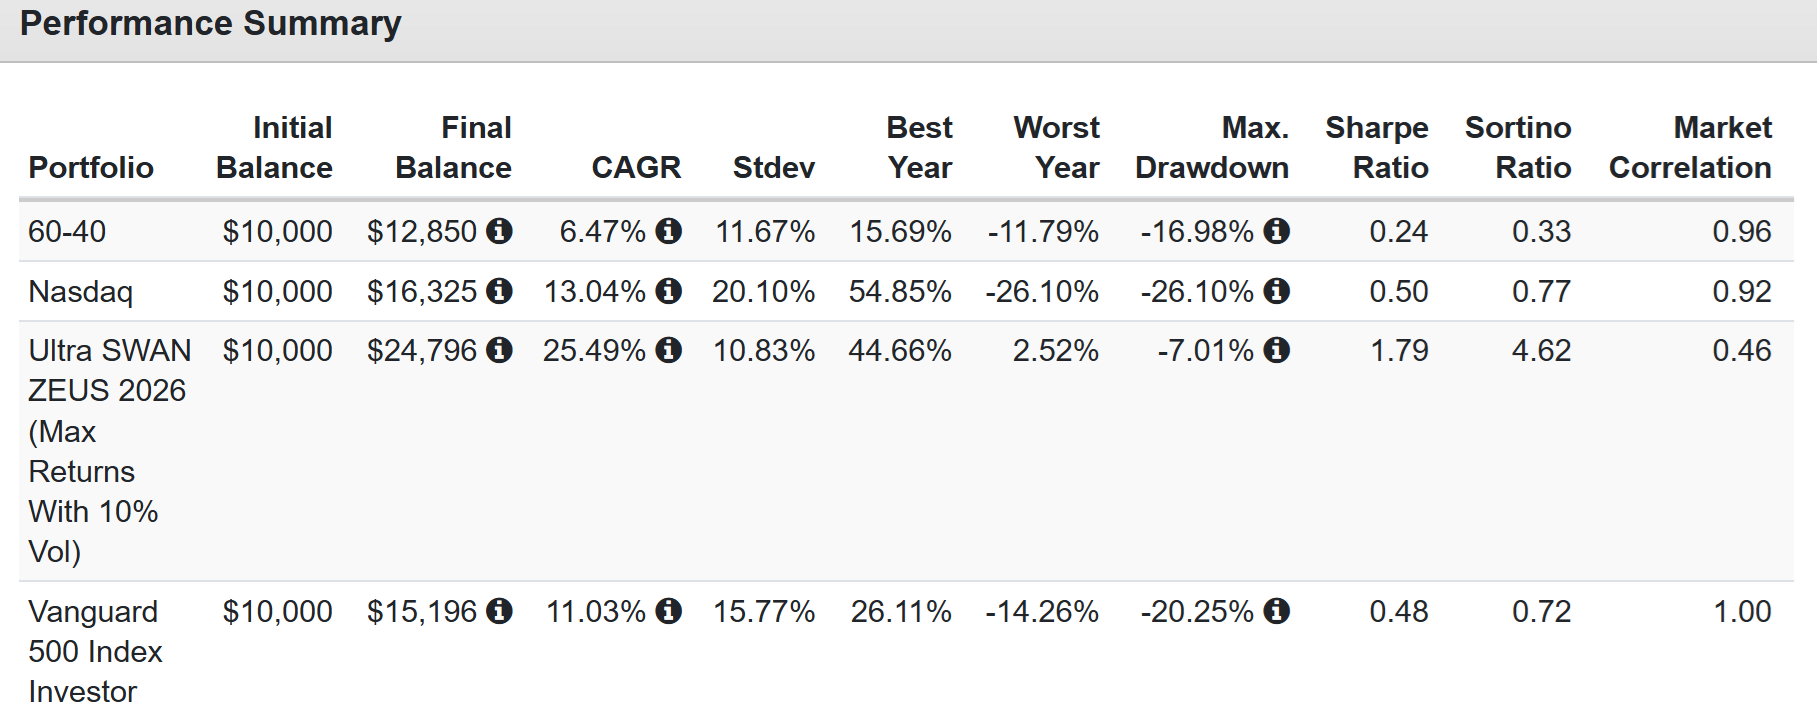
Note the Sortino of the market at 0.72, which is actually the Sortino since 1990.
Sortino ratio = negative volatility-adjusted returns (since no one cares about volatility to the upside).
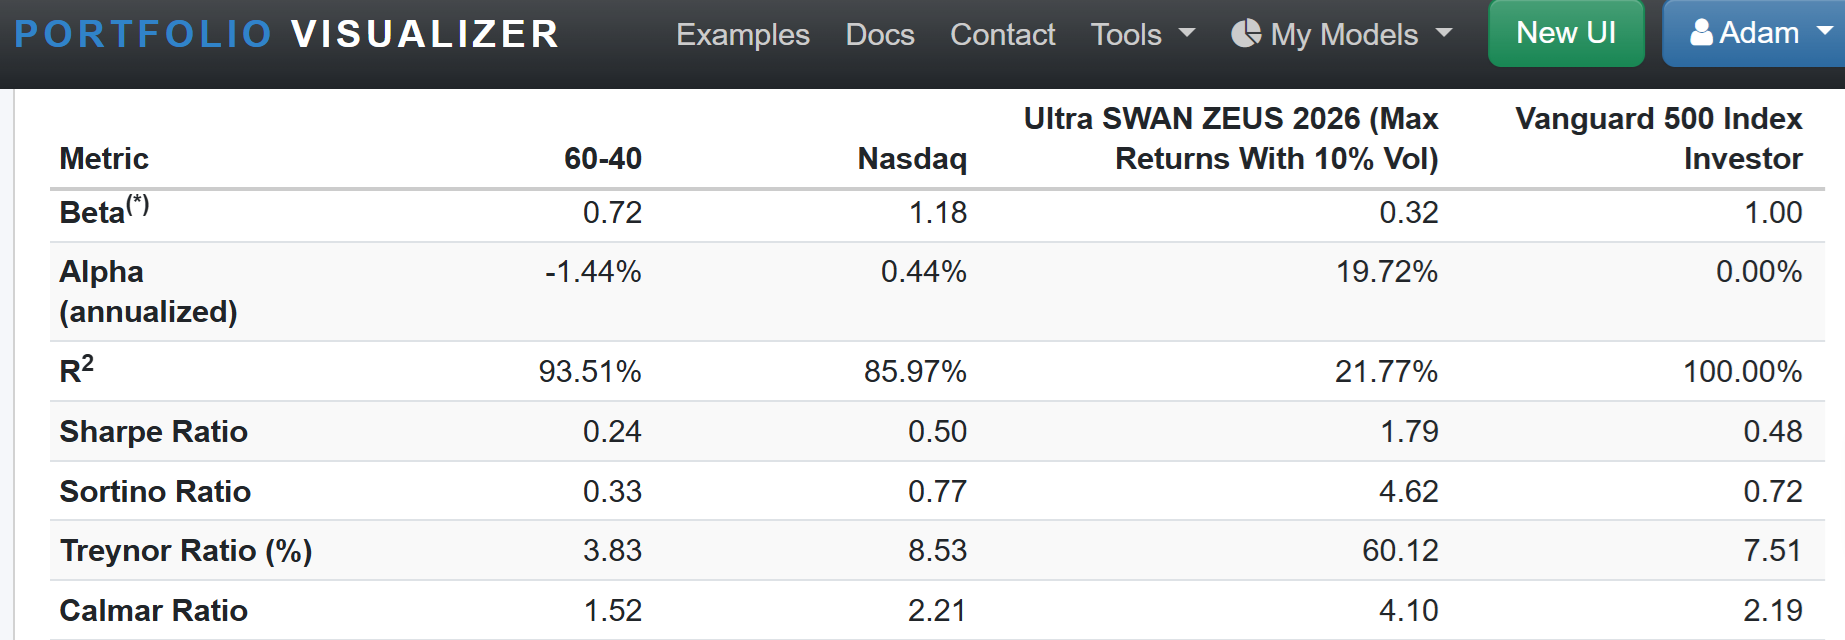
The Treynor Ratio is the excess total return vs the risk-free rate divided by beta. The best hedge funds can achieve about 17 over time.
Can you see why Connor, with 10,000 simulations and our entire 5,000-stock database, wasn’t able to optimize ZEUS much (no more than a 2% superior return potential and higher volatility)?
12 years of steady improvements to ZEUS have made it almost unbeatable…statistically speaking.
As long as the AI boom continues, of course😉
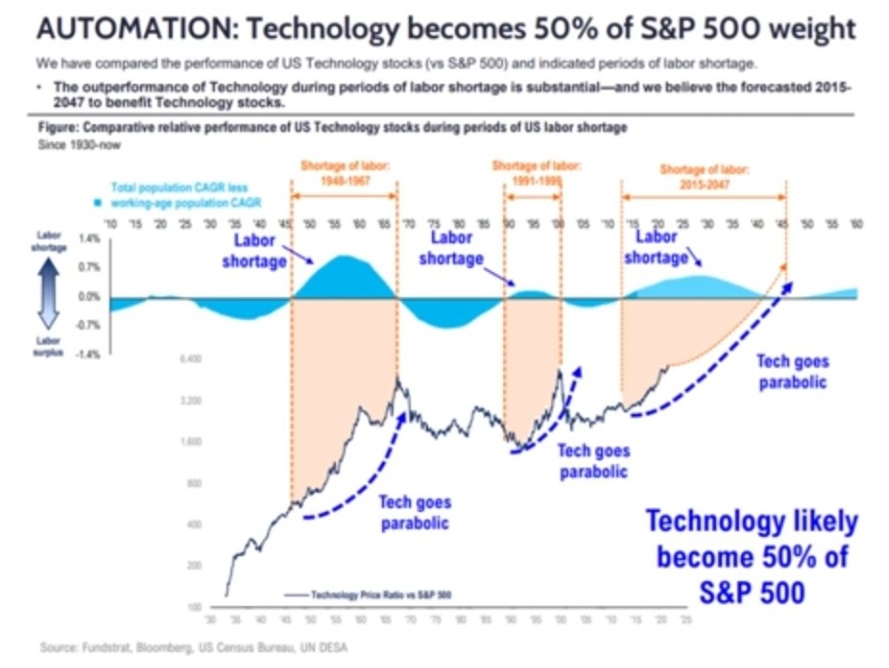
According to the demographic model at Fundstrat, a global labor shortage and rise of automation mean the AI boom has “just” 21 more years to run.
2009 through 2047 is a 38 year secular tech bull market. And “no one” except for Tom Lee, Danny Ives at Wedbush, Morningstar, me, and a handful of others are seeing it😉
Stop overthinking facts. Don’t say “I can’t understand how this is true, therefore I’ll assume it isn’t”.
Jeremy Grantham of GMO (legendarily called 4 bubbles) has been calling tech a bubble since 2010 (in 2010, he predicted a lost decade for stocks when the S&P was trading at a PE of 13😂.
To paraphrase his argument “Profit margins are the most mean-reverting data point in finance, margins can’t stay this high, growth must slow, therefore historical growth rates of 5.5% to 6.5% are still valued, and therefore stocks are NOT worth more than their historical 15 PE.”
Ben Graham’s 15 PE rule of thumb was based on 50 years of market returns he had calculated at the time. 15 PE = 6.7% earnings yield + 5% historical growth = 11% to 12% expected return, similar to the 10% the market actually delivered.
Sorry, Mr. Grantham, Profit Margins Have Actually Been Trending Higher Since 1990 (Start of The Computer Boom)
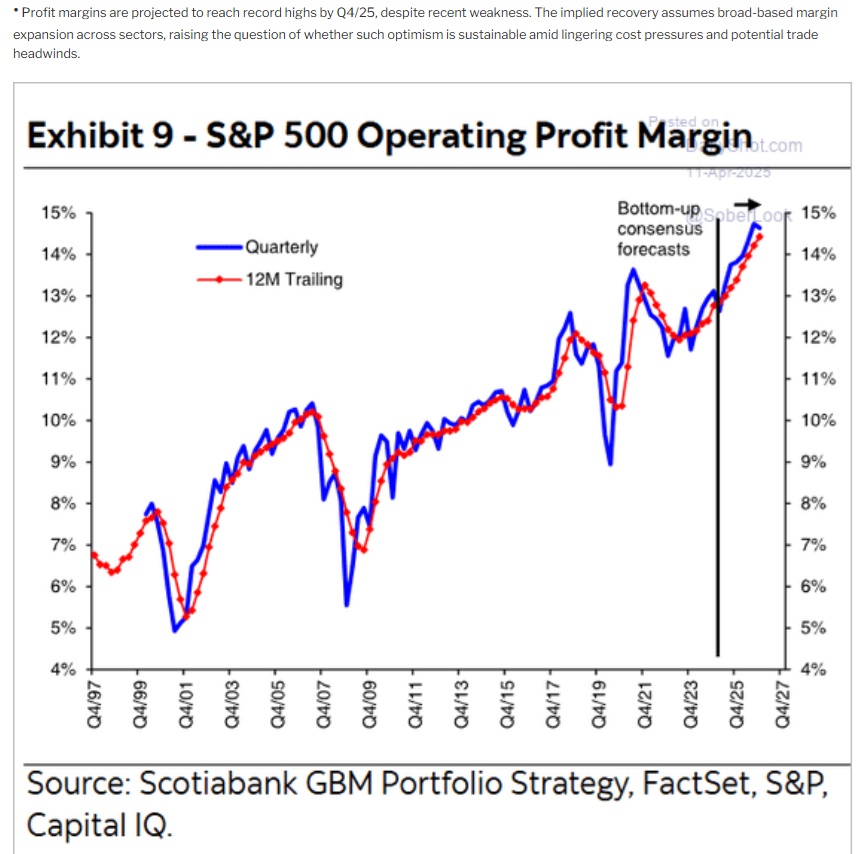
Do you want to know the STORY of why profit margins don’t mean-revert? Because we’re not in an economy of oil companies or railroads selling commodities. Moats exist now. Just ask Microsoft, Amazon, and Google Cloud. No one is disrupting them with a garage startup like they did in the 1980s😉
“But the margins can’t possibly keep rising forever!”
Here’s the math. If revenue goes up 2% and costs go up 1%, then margins rise. Do that every year, grow sales faster than costs…and margins keep rising.
So there’s your story (and it fits the actual data) and there’s the math (for why the margins going up isn’t a bubble).
But guess what? You don’t have to believe me; just believe the chart: when profit margins rise, PEs rise too. So there you go…why PEs rising over time (along with profit margins and growth rates) justify these current valuations (and then some).
Feel free to ignore my explanations, but NEVER ignore the facts.
Any story you choose to believe MUST always support the facts, not the other way around.
Sign in to leave a comment and join the discussion.
Sign Up Free