Mini-Update
I am SO excited about the progress our team has made! Connor and Glenn have been burning the candles at both ends (we’ll be bringing on a new developer in a few months to ease the pressure off Connor so he can focus on building even better tools!
We’re very close to finishing the safety and quality calibrations.
We now have 4700 companies in the GNG universe, so it’s taking some time to ensure the safety, quality, and valuation model is correctly calibrated for the new, almost 10X-larger universe.
As soon as we’re done, I’ll be able to resume 1 to 3 weekly screening articles, the ones that DK members loved like “The 5 Best High-Yield Aristocrats to Buy Right Now” and things like “5 Blue-Chip Bargains You Have Never Heard Of But Will Knock Your Socks Off”.
Articles that teach disciplined financial science while highlighting great ideas and showing how to use our tools are my favorite kind of article, and we are VERY close to being able to do that.
We’re cautiously optimistic that we can get there by Friday (due to the shorter Christmas week).
OMG! WHAT DID I JUST SEE!? Welcome, Friend, TO GNG! 😉😂🤣
Connor has been working on bringing Monte Carlo Simulations to our members.
Portfolio Visualizer runs 10,000 Monte Carlo simulations, and we can run 100,000 or even 1 million using various time frames, including up to 20 years.
The platform can run Monte Carlo simulations on individual stocks (unlike Portfolio Visualizer Premium) and even estimate cash flows from portfolios.
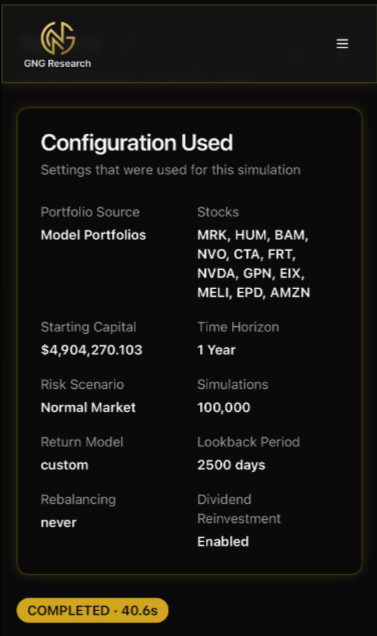
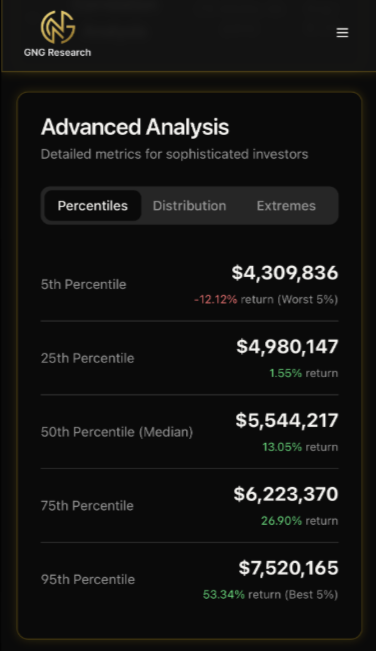
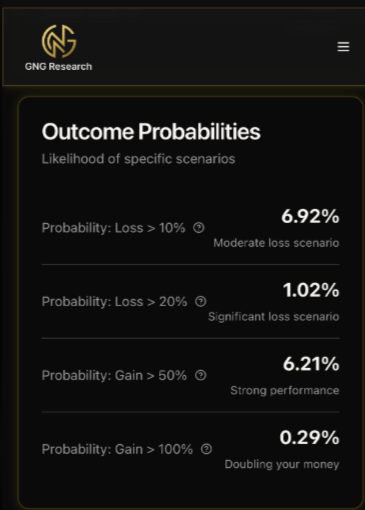
This is Connor’s estimates for how ZEUS (the current, manually optimized version) will most likely do if we withdraw 0.5% per month over 2026.
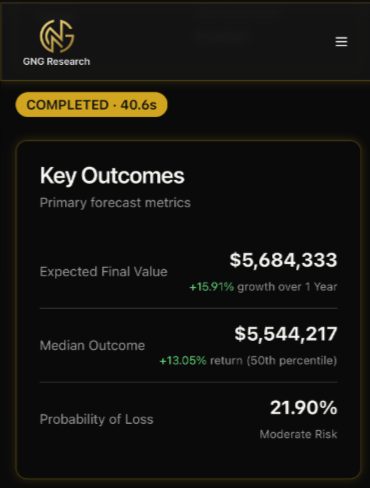
Granted, the 0.5% monthly withdrawal rate, totalling $290K over the year, is a placeholder for what it might take to run GNG. We’re cautiously optimistic that we’ll break even by the end of 2026 (even with rising costs from expanding the team and improving our tech). 😉
The Kind Of Market Analysis That The Big Institutions Run For Hedge Funds….But Applied Towards YOUR Portfolio!
We’re using the same statistical methods that big firms like Goldman and Morgan Stanley use to create reports and forecasts for the S&P and their big institutional clients. But we’re applying it to individual portfolios.
The “power of the financial gods” is being brought down from Olympus and given to us mere mortals. Thanks, Connor! 😉🥳
Are you as geeky as I am? Do you love to know advanced volatility and return metrics? Well, we have you covered! 😉😂🤣🥳
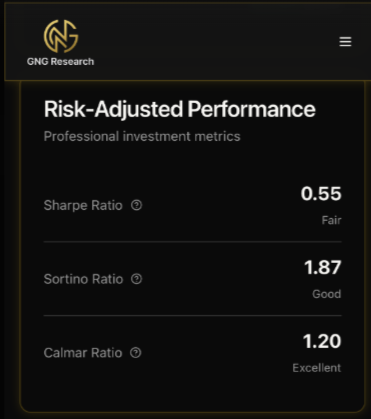
The Sharpe ratio is total returns/volatility.
Sortino ratio is total return/negative volatility (the only kind people care about)
And the Calmar ratio is total return/the single biggest decline (crashes that keep you up at night).
S&P Calmar Ratio is 0.17.
ZEUS historical Calmar is 0.91 (5.35X better than the S&P)
In 2026, ZEUS is expected to be 1.2 Calmar vs 1.08 most likely S&P outcome (More on that later😉).
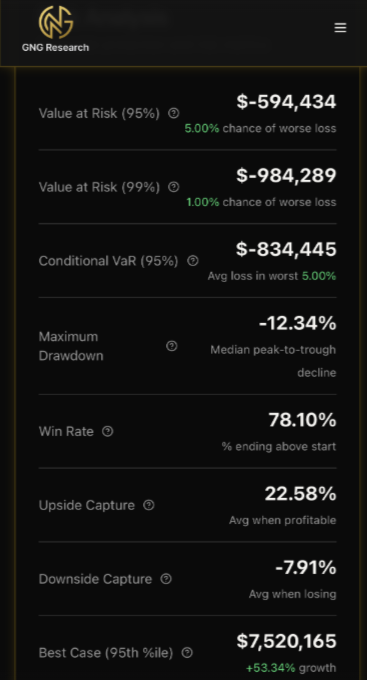
Worst-case scenario modeling? Of course!
Upside and downside capture ratios? We have that too!
Most likely peak decline for your portfolio? Come on, people, THIS is what everyone REALLY wants to know when they ask “What do you think the market will do in 2026? 😉🥳
Now, can you see why we’re so excited about GNG Research? Why its so much more than what Dividend Kings could ever be (due to Seeking Alpha’s terrible tech)?
And wait until we get Plaid integration complete (so you can connect portfolios for analysis without ever having to manually update trades again!).
We’re a few weeks away from that AND portfolio optimization, like what Connor and I will be doing with ZEUS in the next few days!
Special report on ZEUS optimization coming soon! 🥳

Just wait until you see what Connor is cooking up in terms of superior hedging options (coming soon!).
I am not allowed to say yet, but it’s mind-blowing! 😉🥳
Thank you to everyone who has signed up for a 30-day free trial. I am confident that by the time your trial is over, I hope the value we’re offering is AT LEAST as good as what Dividend Kings was (you get your DK Price for life), but hopefully you will agree that GNG is a steal at twice the price (or more)😉
And now onto the report (including an entire section about the S&P’s most likely 2026 via 1 MILLION Monte Carlo Simulations😉🥳
The Entire Preparing For 2026 Series
Part 1: 3 Shocking Facts Smart & Safe Investors Need To Know
What you need to know about market valuations and earnings.
Part 2: 5 Delightful Economic Facts Smart Investors Can Profit From in 2026
What you need to know about the economy, including current growth rates (2.3%) and likely 2026 growth acceleration.
Part 3: 3 Incredible (But True) Facts About The "AI Bubble" That Smart Investors Need To Know For 2026
AI update, and why the “AI Bubble” likely isn’t one and might be the beginning of a 22-year growth cycle.
Part 4: What Smart Investors Should Expect In 2026
Predictions are FUN, and that’s why humans make them.
I happen to think that the consensus for 2026 is mostly accurate (or at least the most likely outcome given my research and our models) but let’s be real…the #1 question every investor wants to know is “What will MY portfolio likely do in 2026”.
The 2nd question you probably have is “What course will MY portfolio take to get there in 2026?
And then the 3rd question is the nerdier “What will the market do next year and what course will it take to get there?”
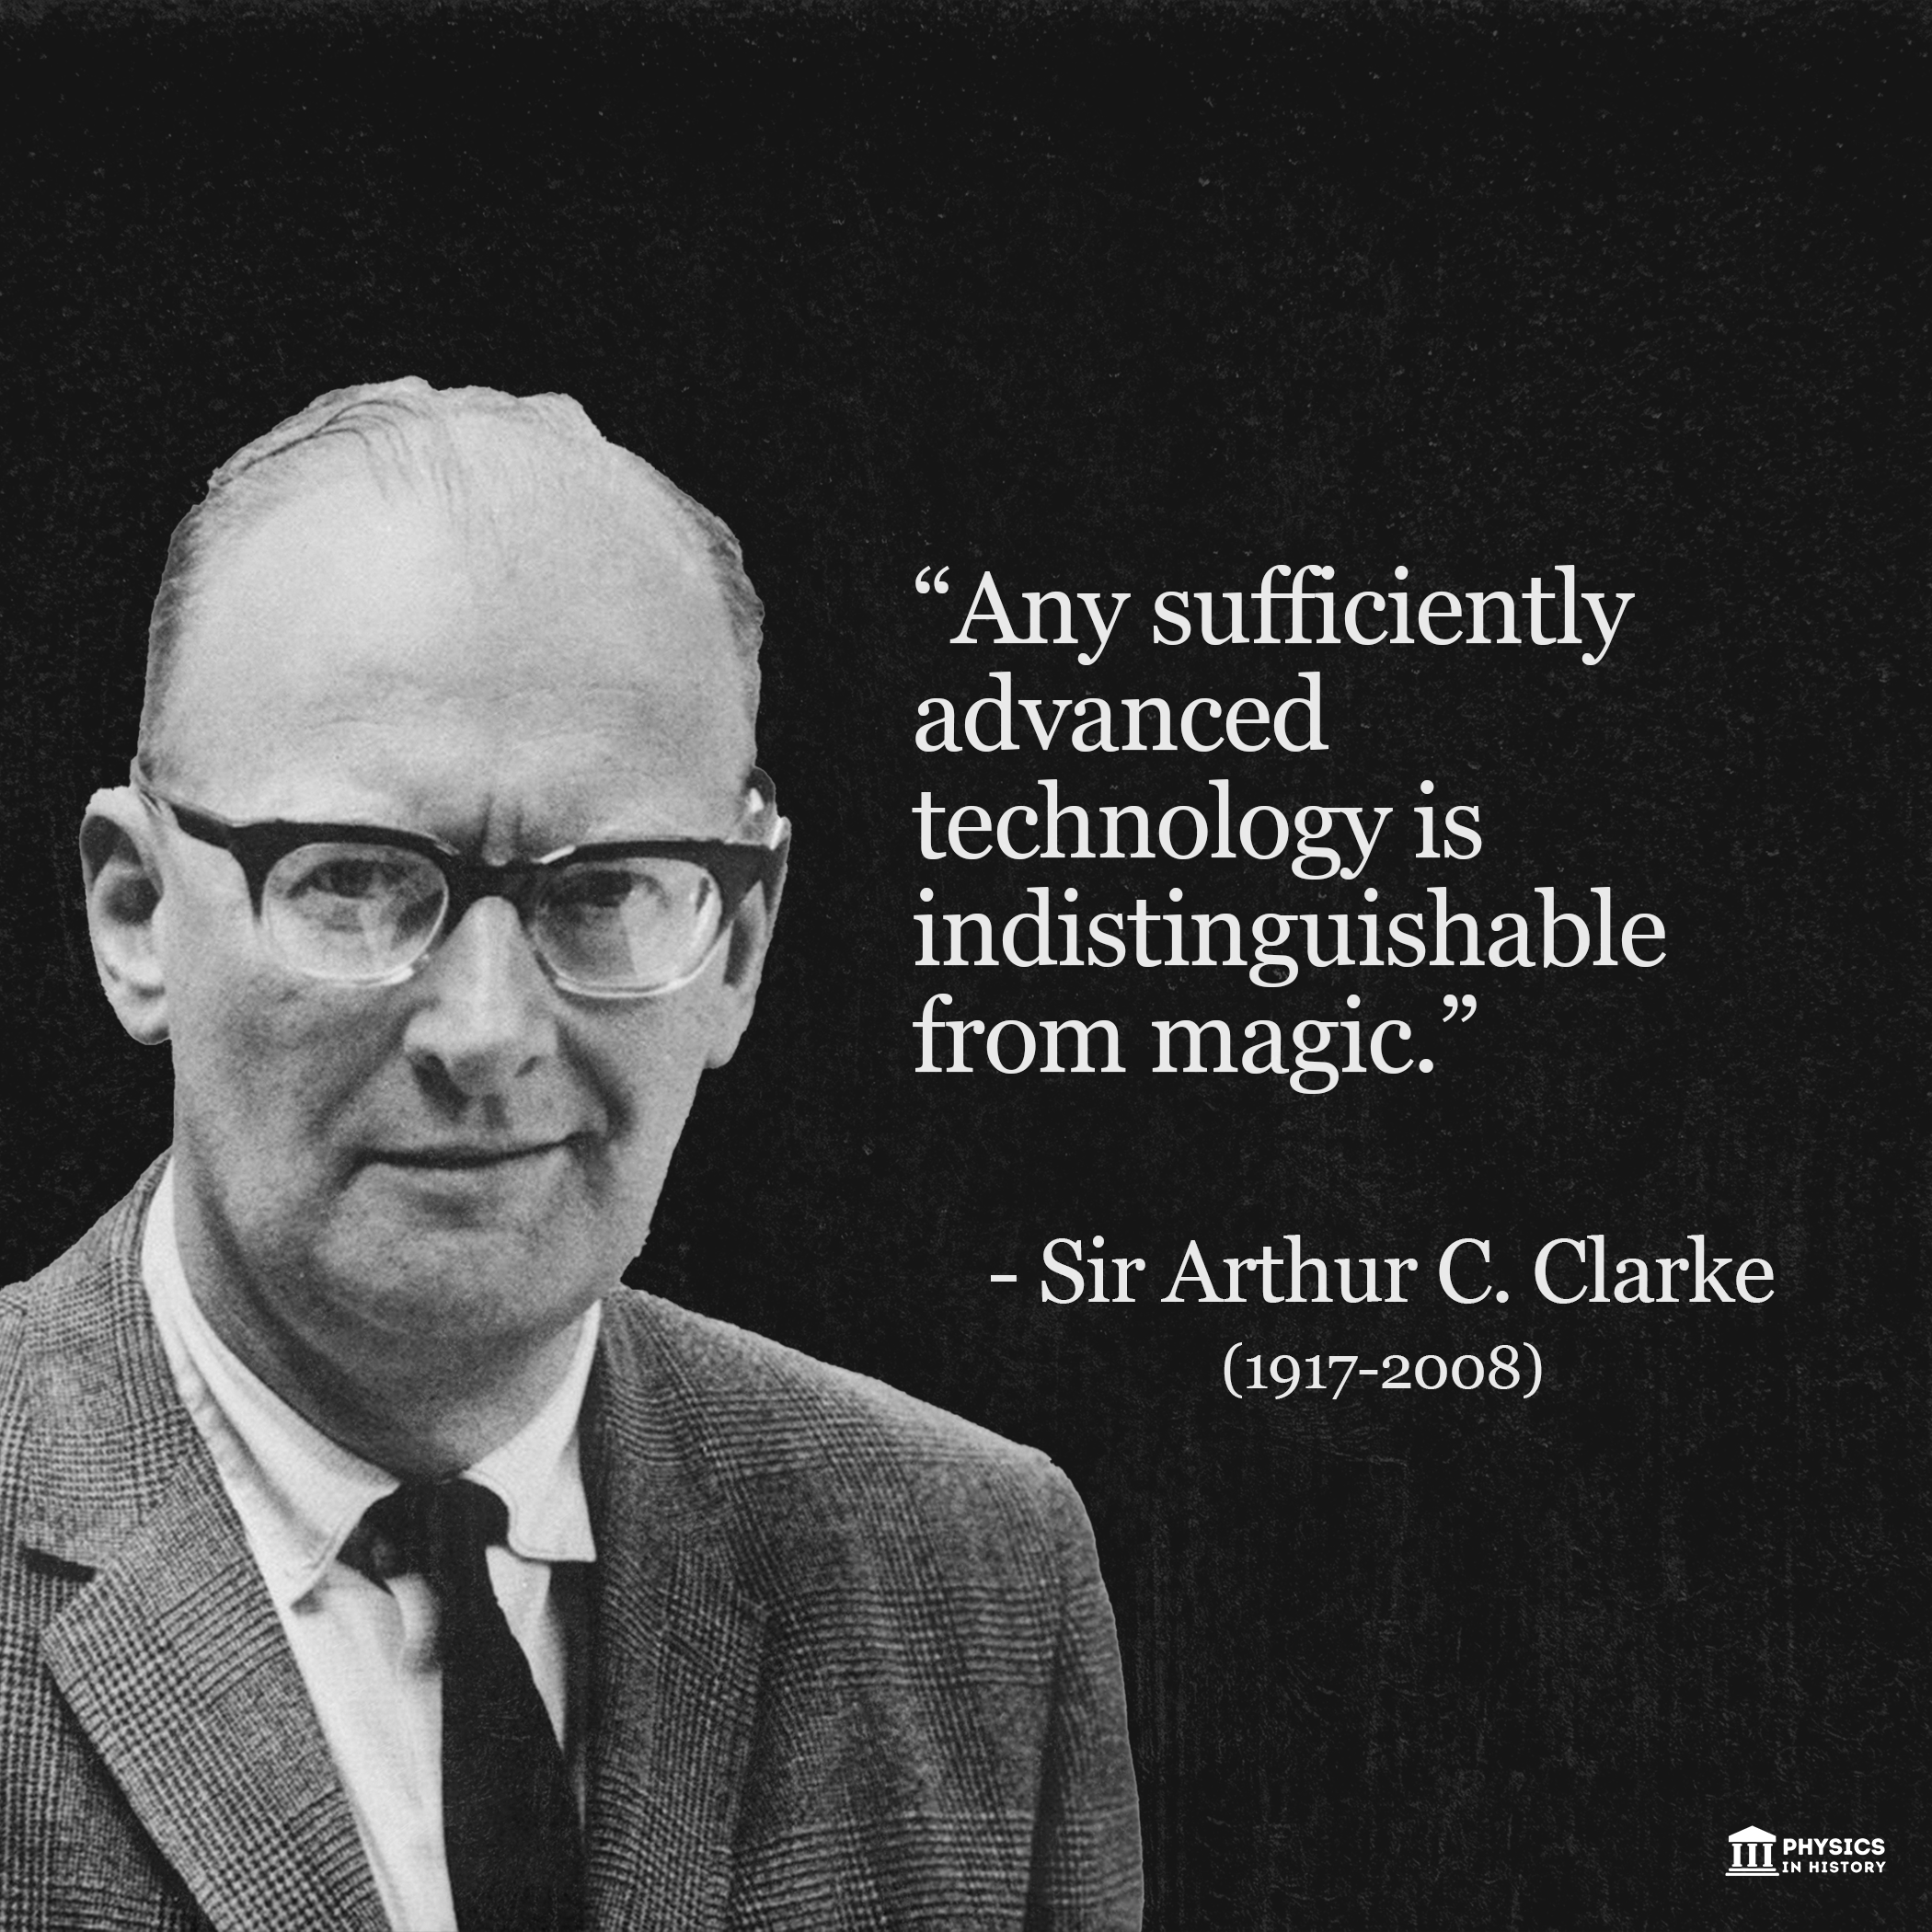
Well, despite the excitement I have over our new tools, Connor, Glenn, and I are NOT actual wizards😉😂🤣
This is science-based magic, and math-fueled sorcery, I assure you.
Monte Carlo Simulations can’t tell you with precision when corrections will occur, only what the most likely outcome is over a specific time period.
In other words, a Monte Carlo for 2025 that had correctly simulated the peak decline of -21.3% on April 7th (due to the tariff crisis) would not have been able to tell you that the market would peak on February 17th and would bottom on April 7th.
Nor could it predict headlines like the Pause on April 9th, which sent the market up 10% and put the bottom in that particular bear market.
When launched, you’ll Be Able to Run Analysis on ETFs as well (So S&P, Nasdaq, Mag 7, ARKK, SCHD, or anything else you want!)
Yes, we really are this nerdy, and we hope you can at least appreciate our joy at how cool these tools will soon be!
Fact 1: What The Stock Market Is MOST LIKELY To Do In 2026 (Based On 1 Million Monte Carlos!) 🥳- It’s All Probability Curves People! But Here Are The Curves😉
Let’s start with some real geekery, because after showing you the really cool Monte Carlo tool coming soon, I’m sure you are dying to know what the probability curves look like for 2026.
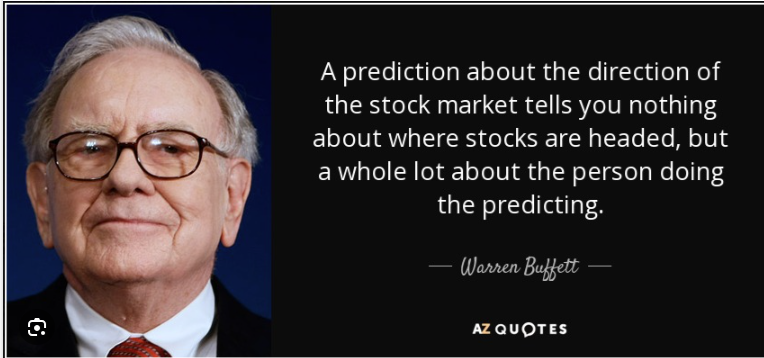
Remember what Buffett said about forecasting: it tells you about the forecaster (the assumptions and why they used them), not about the actual future.
I’m a disciplined financial scientist who will show you the raw data, and walk you through what it means so that we can FEEL like we know the future (that’s why discussing forecasts is fun after all😉😂
So let’s try to maximize the statistical fun by looking at a 1-week, 1-month, 3-month, 6-month, 12-month, and 5-year Monte Carlo (the one Connor ran for me on Friday, Dec 19th).
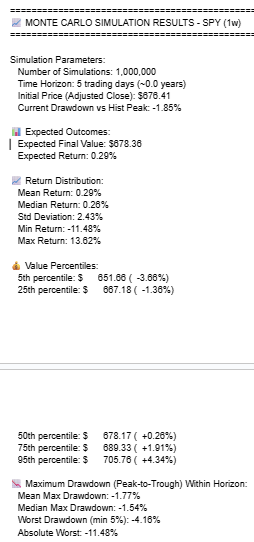
In the next week, the market is MOST LIKELY to go up (around 0.3%) with a range of -11.48% to 13.62%.
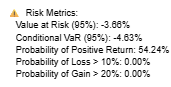
The probability of the market going up is 54.24% (on any given day, its 52%), and this is showcasing the Santa rally nature of December being the best month for stocks, historically speaking.
Conditional value at risk is the average of the 5% worst outcomes, providing a kind of “realistic worst case scenario” analysis that shows stocks might fall 4.63% if we have a REALLY crappy week.
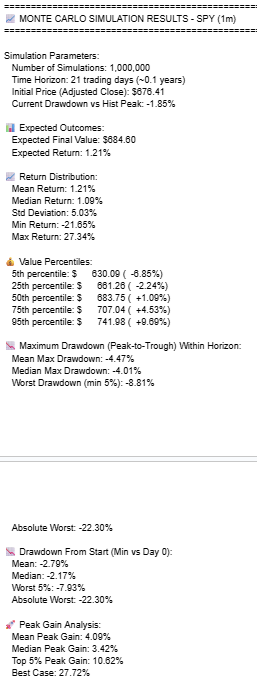
Over the next 1 month, the most likely outcome is a 1% to 1.2% gain, with an excellent month at 3% to 4% and a bad month at -2% to -3%.
For January, there is around a 59% chance of a gain, with the risk of a modest 10% correction being around 1%, and the probability of a face-ripping 20% rally being around 1 in 333. Why do we care? Because these are the kind of long-tail outcomes that people dread (or dream about), and why shouldn’t we have a reasonable estimate of the probability of those?
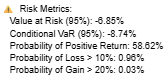
For Q1, we’re looking at around a 65% (2 in 3) chance of a positive return, with a really good quarter being a 7% to 8% gain and a really crappy quarter being a -7% or -8% quarter.
A 3% to 4% gain is the most likely outcome in Q1 (which aligns with the fundamental analysis of the economy, corporate earnings, and the effects of tax cuts, stimulus checks, and rate cuts next year).
To show you just how good the market’s fundamental backdrop is next year? The risk of a 10+% correction is around the same as a 20+% gain.
That’s approximately a 2:1 reward/risk ratio vs a 1.42 ratio over the last 100 years.
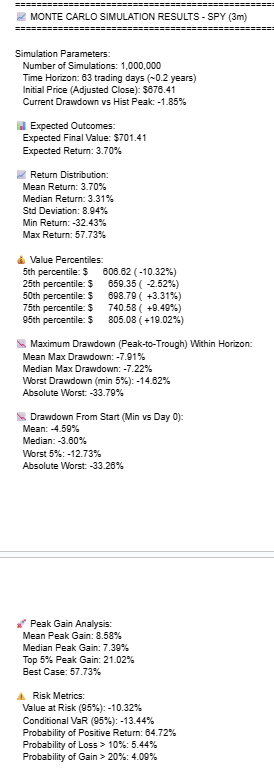
The most likely outcome for the first half of the year is a 6% to 8% gain (7.55% based on the fact that Connor set this to identify long-tail risk outcomes).
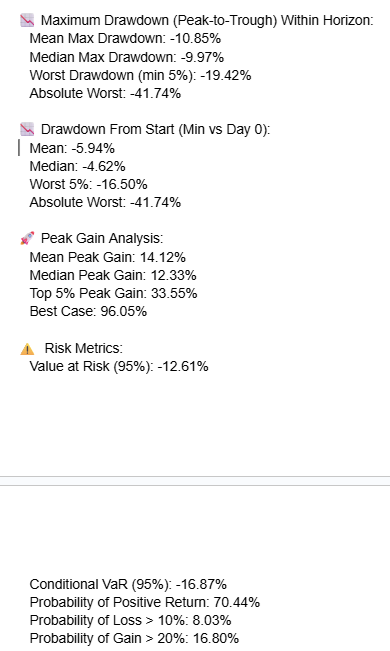
The probability of a gain in the first half of the year is around 70%, with the risk of a 10+% decline being half that of a 20+% gain.
A 9% to 10% correction? That’s the most likely peak decline at some point in the first half of the year, but the outcome after the first half is 70% likely to be positive and a really solid start to the year.
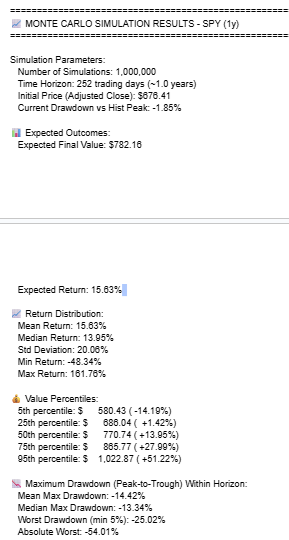
The full year? A 14% to 16% gain is most likely (the same returns we’ve had since 2009), and remember what I showed you in my Part 1 of this report series.
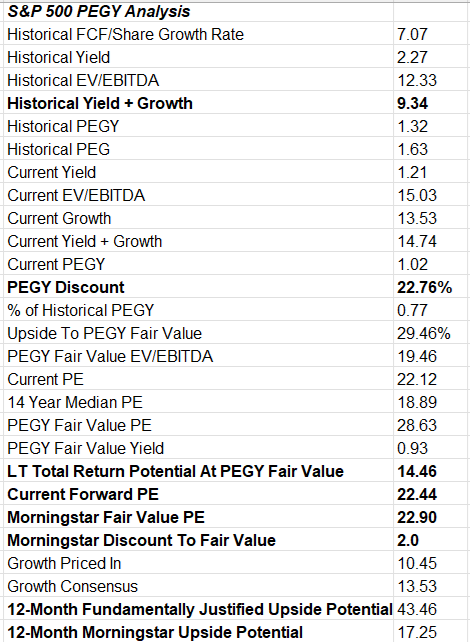
So, Morningstar’s 12-month fundamentally justified return potential? 17%. And our base-case most likely outcome for next year? 16%.
And remember what I told you about the market’s PEGY valuation? How, at a 22% discount to fair value, is the market currently around the same level of undervaluation as March 23rd, 2020? And October 12th, 2022 and April 7th 2025?
That means a 44% upside to fair value potentially, IF AND ONLY IF earnings grow as currently expected AND also the current growth outlook is still valid 12 months from now.
What is the probability of stocks going up next year? 78%, which isn’t much better than the 76% of up years since 1980 or the 71% since 1928 (including the Great Depression).
But note the potential gains in a good year, 21% to 24%. The median gain in an up year since 1990 is 20%, and the average? 21%.
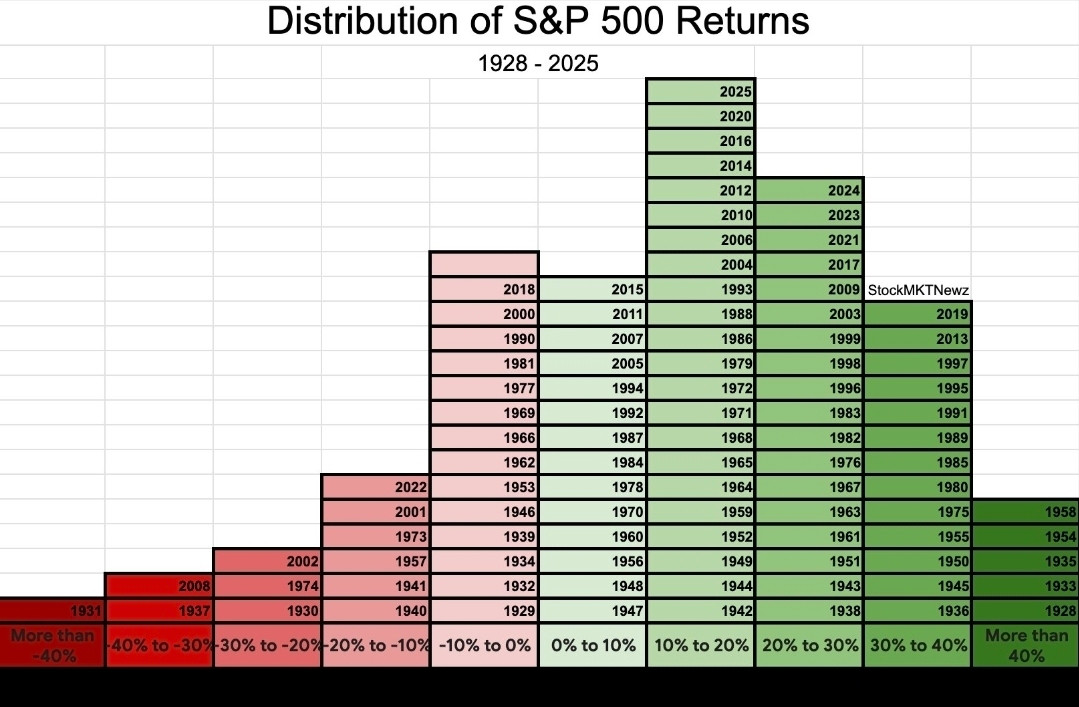
The probability that the S&P is up 20+% is 1.42X greater than the market going down by any amount, including the Great Depression (the odds are even greater since 1980).
And finally, the BIG question many investors are worried about is the AI Bubble.
Fact 2: The Probability Of A Lost “Rest of the Decade” Is…
This is a major fear that ine
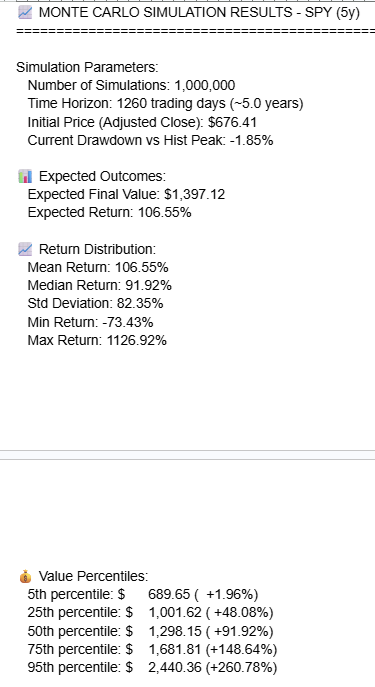
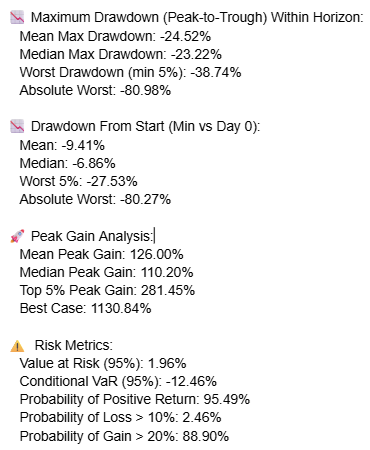
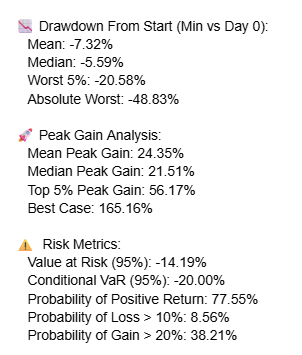
If the worry is that stocks won’t make money over the next 5 years, the risk is 4.51%, roughly the chance that Altria goes bankrupt over the next 30 years (according to its BBB credit rating from S&P).
What is the probability of stocks being down 10+ or more by the end of 2030? Just 2.46%, with the most common outcome a 91% gain (with 106% our base-case since these simulations are designed to search for fat-tail risks.
Or to put it another way, the probability of the stock market rising by around 100% over the next 5 years is about 20X greater than a 10% or higher loss, and about 10X greater than the stock market failing to deliver a positive return.
Does this agree with the economic and earnings fundamentals we’ve been tracking for months? Absolutely, it does. But now we have the specific probabilities to share with you.
Merry Christmas, my fellow investing nerds!

Fact 3: What’s Most Likely Over The Next 7-10 Years
Fact 4: Some Really Great Ways To Plan For Your Financial Future (Including Retirement Planning!)
Coming Tomorrow in Part 5 of This Report! Yes, there is a part 5! 😉🥳
Have a great night, everyone! Thank you for all your support that allowed Connor, Glenn, and me to do all this! We’re just getting started, and we are going to blow your minds, tickle your funny bone, and help us all grow rich together!
Because at GNG Research, we’re crazy enough to think we can change lives, and smart (and hardworking) enough to actually pull it off😉😂🤣🥳