Personal Update
This is the week of Connor’s wedding, so I’m very busy getting ready for that (while sick), so I appreciate everyone’s patience with this 2 part report.
Normally, at the end of every month, I do a “Top Buy List” screening article, targeting the best value (including high-yield) investing ideas and growth blue-chips.
After analyzing the FAST Graphs charts (which I’ll include) I select the top 10.
But I include all of the top buy list in the monthly Ultra ZEUS optimization report.
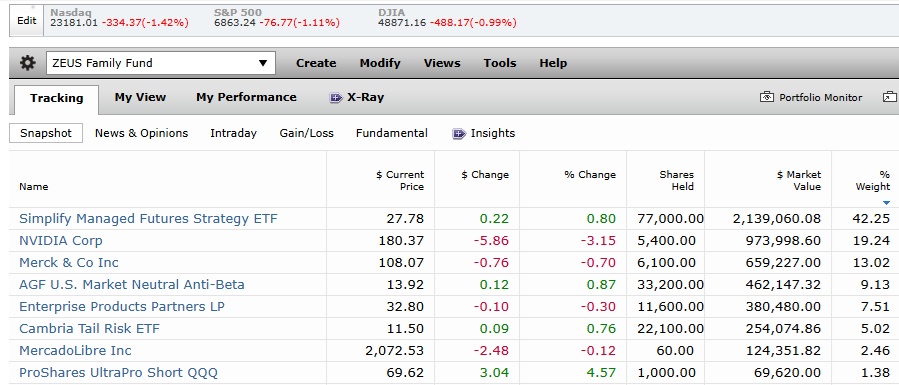
The Monthly ZEUS update includes both the version of Ultra ZEUS (V2 for now) that my family and GNG are actually using right now and also the GNG ZEUS, meaning the one designed for “reasonable and prudent investors”, more general, the one that those who want to mirror can mirror.
We can’t actually track that since we’re moving to Plaid integration, but I’ll present it every month and the basic framework of ZEUS is designed to be 90% determined by asset allocation.
I’ll explain more in part 2, but I can’t do that until I get back from the wedding.
I woke up with a 15% body battery according to my Garmin after a 31% quality sleep night (sickness interrupted sleep) and I have a doctor’s appointment today.
Rather than try to rush though 2 articles and half ass it, I’m going to do the right thing and give each one the time it deserves and this might even be a 3 part report.
In case I don’t have time to do the full FAST Graphs analysis for today’s top screening ideas.
I want to sincerely thank GNG members for their patience, understanding, and support.
Due to My Crazy Schedule Today, I Might Not Be Able To Update The Official Top Buy Tool Until Tomorrow Or Thursday
Mini Macro Update (Due To The Greenland Emergency)
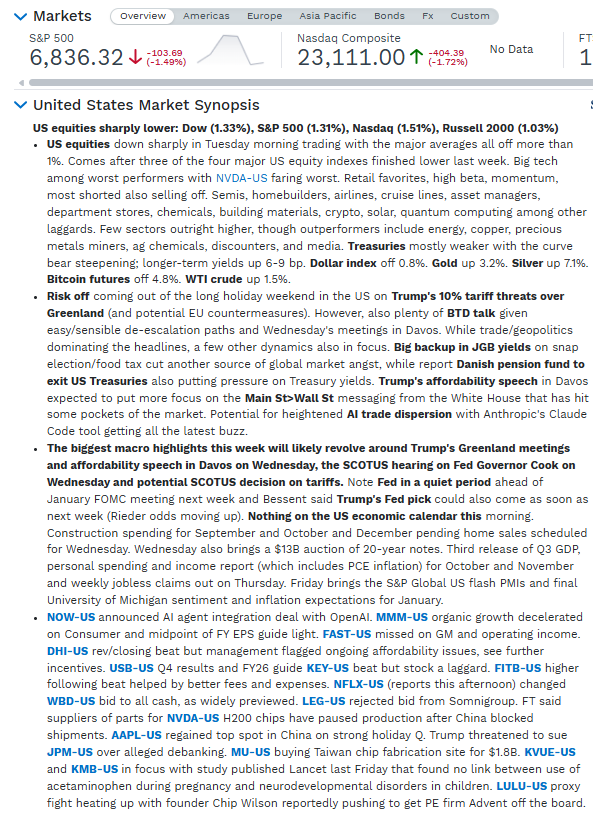
I know that a lot of people are worried whether or not this Greenland crisis might trigger another April 2025-style “Tariff Tantrum.”
I don’t have time to go through all of this, so I’ll just let FactSet provide an update and then provide a “TLDR summary”.
TLDR= Too Long, Didn’t Read
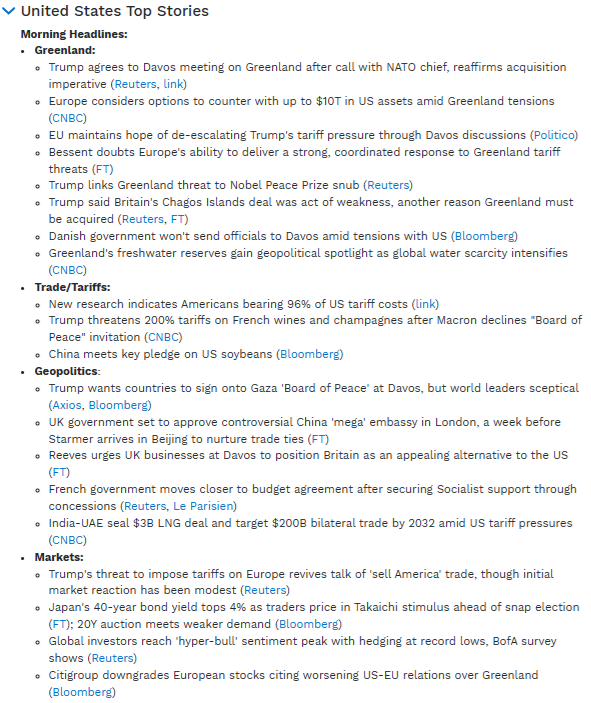
The worst-case scenario would be NATO dissolving after an escalated Greenland crisis, and if the EU were to sell its US assets (they have $12.5 trillion in total assets), that could crash the stock and bond markets and cause financial chaos. However, it would be a nuclear option that would decimate the EU economy as well, so it’s not likely.
The Most Important Table You Can See Right Now
I Promise The Stock Market WILL Recover…And if it doesn’t, the world has ended, and we’re too dead to care😉😂🤣
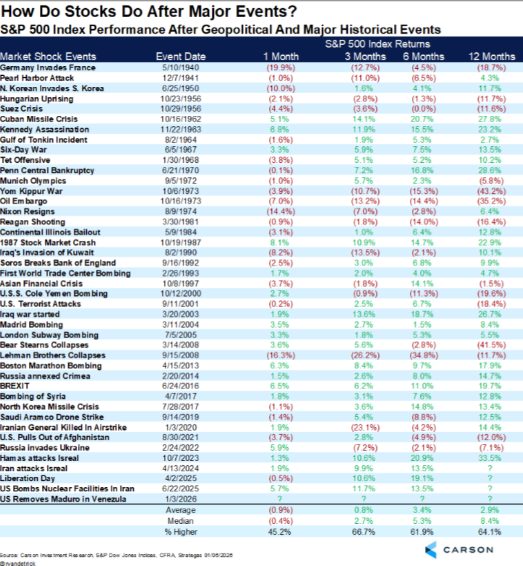
It’s highly unlikely that INVESTORS will still be talking about Greenland 6 to 12 months from now.
If this turns out to be a COVID-like event, I will be eating those words😉
And that’s why we build portfolios like ZEUS.
25% Commodities (long or short), 25% Bonds (long or short) (50% managed futures), 25% Growth Stocks, 25% Value Stocks
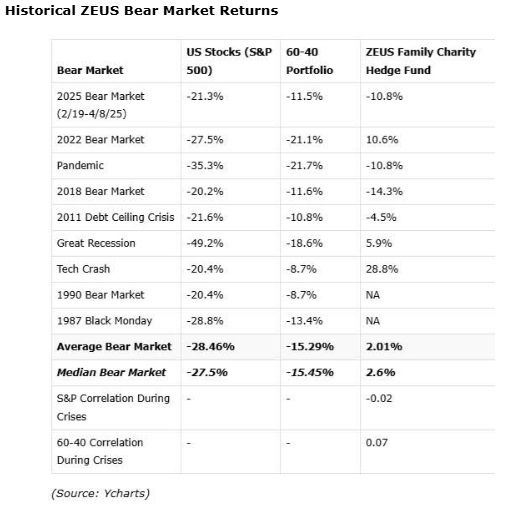
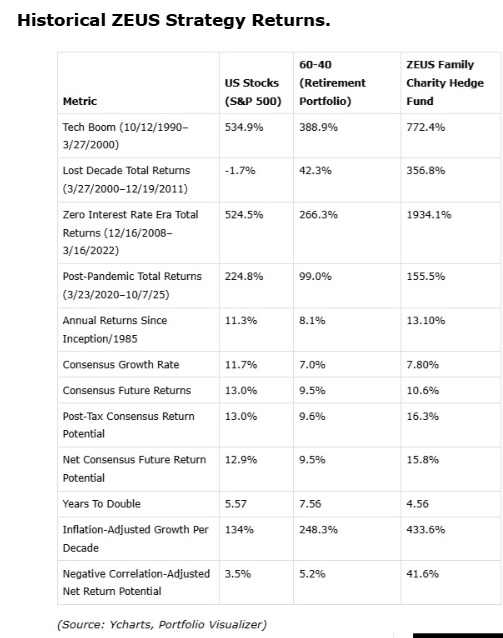
This is a 0.5 to 0.6 beta (volatility relative to S&P) portfolio, and I built ZEUS (12 years of research went into this strategy) to deliver very consistent returns. The “science based magic and math fueled sorcery” is in the asset allocation (portfolio structure) not the individual holdings.
In other words, 90% of long-term returns are based on asset allocation, and the individual stock picks matter in the short-term (like Ultra ZEUS 2026, thus the reason for monthly updates and potential rebalances if the improvements are significant enough.
Just remember that in the short-term (including day to day) even the best designed systems might “fail”.
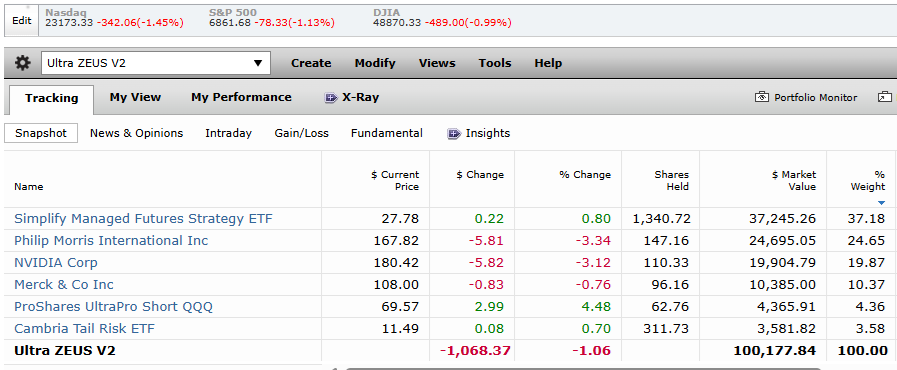
V1 of Ultra ZEUS Is Down 0.22% Today (0.2 Beta vs 0.32 design)
OK, so hopefully with everyone feeling a bit calmer, let’s get to the stock screening.
Top February Investing Ideas
I’m going to provide a top 10 ideas from a quantitative perspective, plus Nvidia if the Nvidia thesis still holds.
NVIDIA (A Top Idea Unless The Thesis Breaks Dramatically)
61% FCF growth this year for NVDIA makes it the ultimate “no brainer” idea where the fundamentals are so strong, that the 60% to 100% return potential means that just about any positive return is justified (not surprising) and a flat or negative year would make NVDA the ultimate growth deep value for 2027.
For Calandar 2025: 61% FCF/Share Growth Consensus
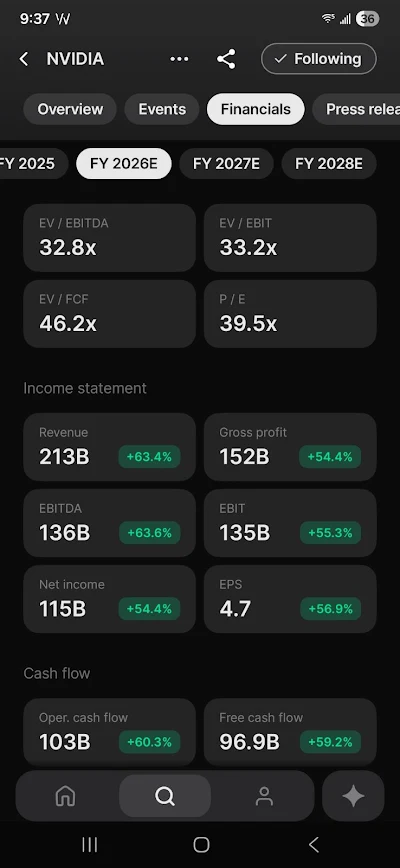
For 2026: 63% FCF/share growth Consensus

For 2027: 30% FCF/share Growth Consensus
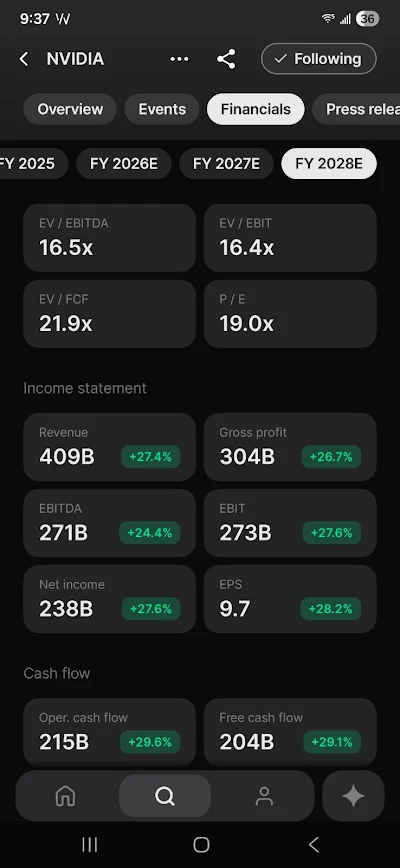
2028, 2029, and 2030 estimates are also showing steady growth (though slowing to 8% to 14%); however, I think estimates that have been rising weekly since Chat GPT came out will likely keep rising. How do we know? Because Nvidia is supply-constrained.
According to management, there is 2X as much demand as supply (company-wide) and 3X in China (for the H200 chips)
China or the US keeps blocking thos,e but it fundamentally doesn’t matter because wafers not going into Chinese H200s go into other chips that are 2X oversubscribed.
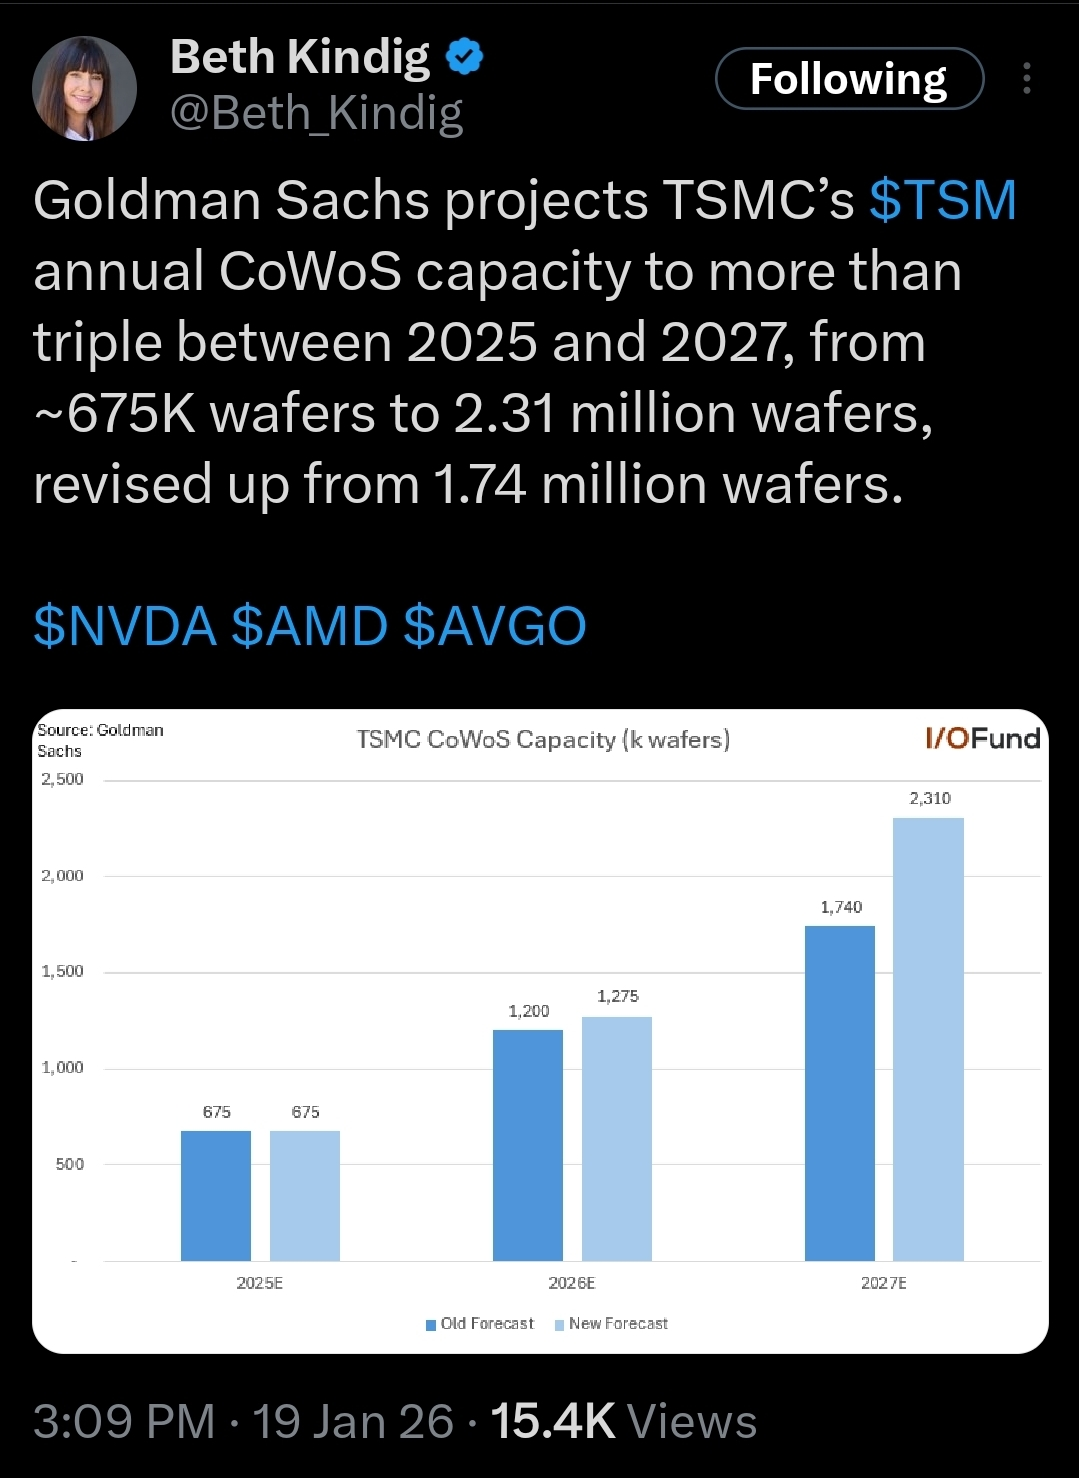
3X Increase In Supply In 2026 & 2027 Vs 2.1X Consensus Increase In Sales & FCF
And now you know why I’m comfortable with Nvidia being at max risk cap of 20% for Ultra ZEUS in 2026. High volatility? You bet. But its fundamentals are simply so strong as to MOST LIKELY overcome any and all bricks in its wall of worry, because the market is forward-looking 12 months.
In other words, if you want to know what a stock is MOST LIKELY to do in 2026? You can’t just look at this year’s fundamentals, but next year’s.
Because by June of 2026, 50% of the market will be based on 2026 (the rest of the year) and 50% on the first half of 2027.
GNG uses a 12-month forward blended PE fair value for our ratings for this reason.
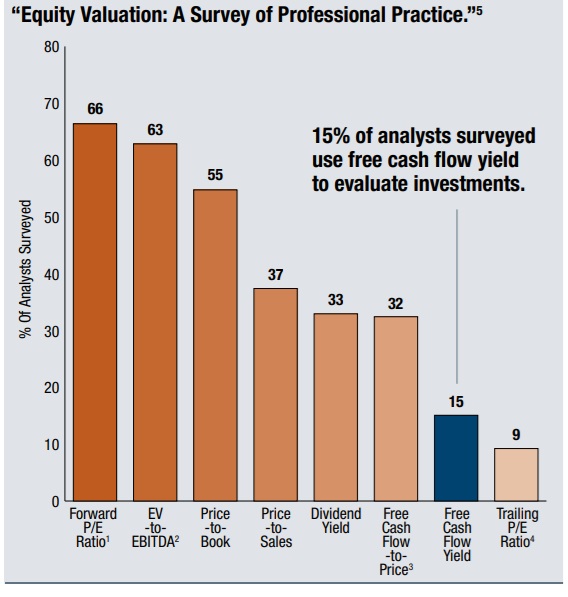
Value is what other people are willing to pay.
80% of the money other people are using to pay is controlled by 66% of fund managers who are looking at 12 month forward PE.
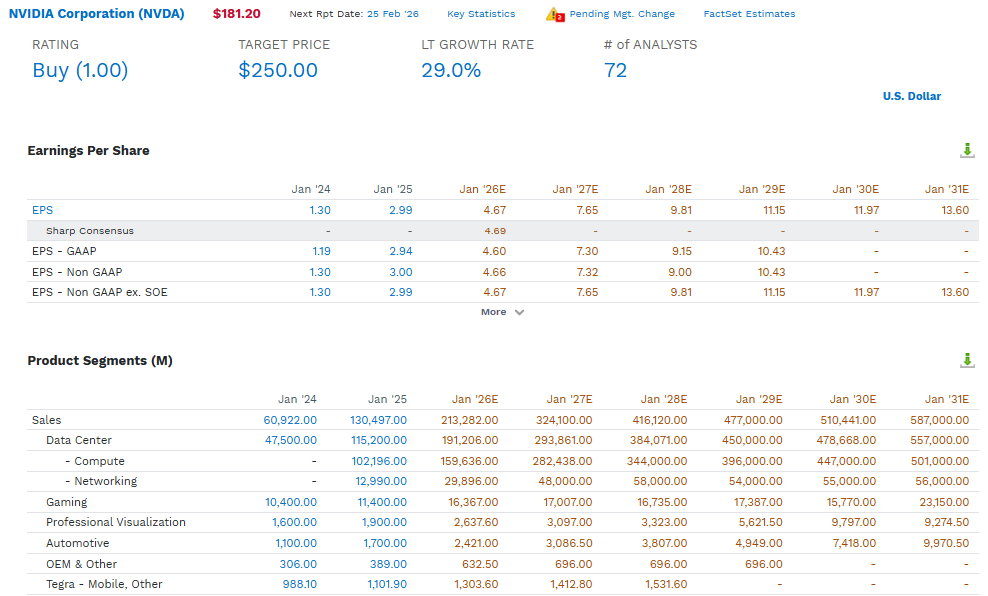
The point is that by the end of 2026, NVDA’s final price is going to be mostly driven by what the market is expecting in 2027 (which is currently 30% FCF/share growth with
If Goldman Sachs is correct, and TSMC can 3X capacity in 2026 and 2027, then Nvidia could grow 63% in 2026 and 84% in 2027…vs 30% currently expected. THAT is how much “risk to the upside” there is.
Next 2 Years NVDA 122% Upside Potential (Actually 3X if TSMC increases supply by 200%)
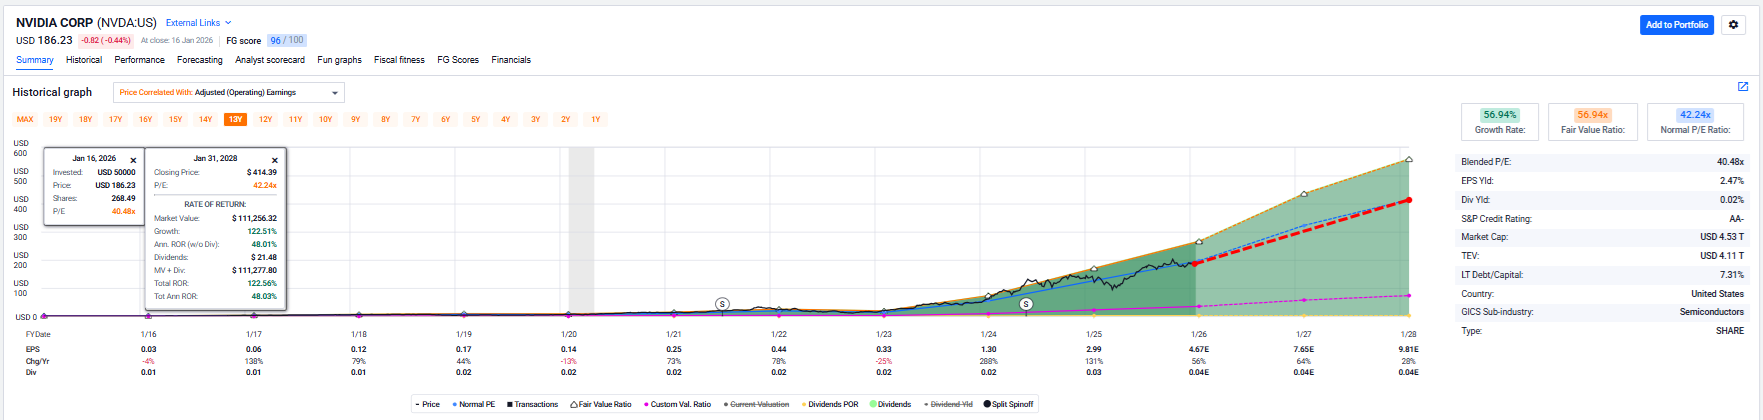
It’s the ultimate “Just believe Jensen and TSMC and make 2X to 3X in 2 years” kind of thing, and as crazy as that sounds, it’s the absolute truth.
And here’s why I’m pinning Nvidia to the Top Buy List this year.
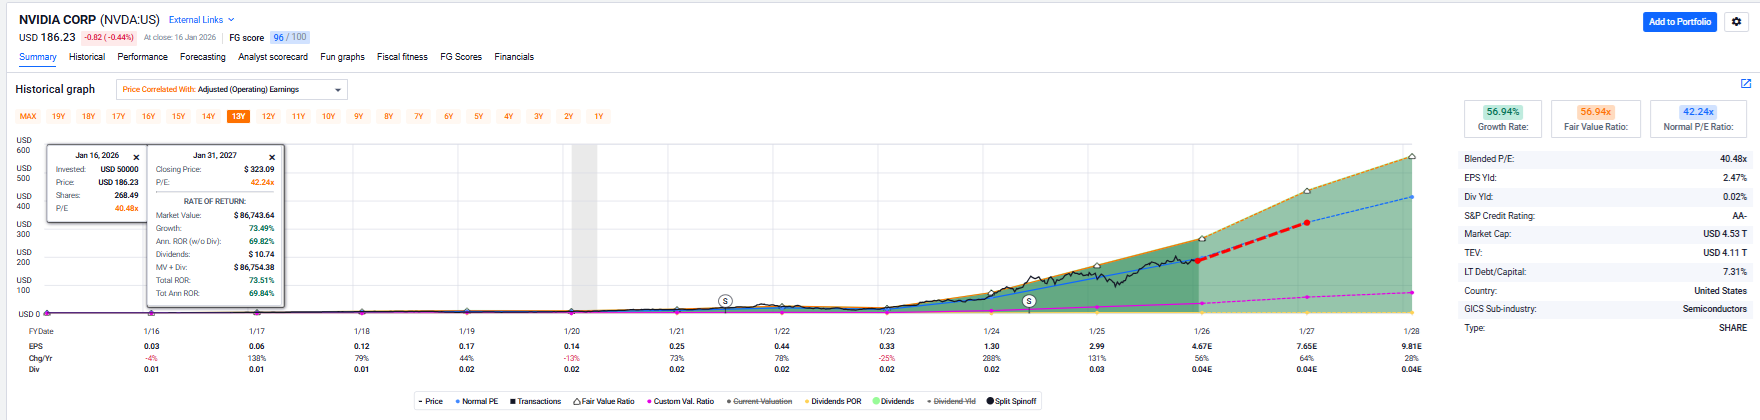
Including Today’s 4% Decline, 78% Upside Potential In 2026
And Now for Non-NVIDIA Ideas (Screening Tutorial)
Since this is part 1 of a multi-part report, I’m going to take you through how I’m screening for these companies step-by-step.
Tutorial Videos are coming Soon
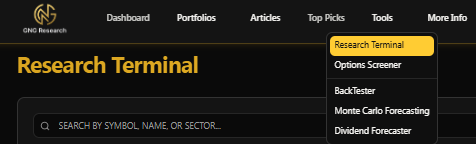
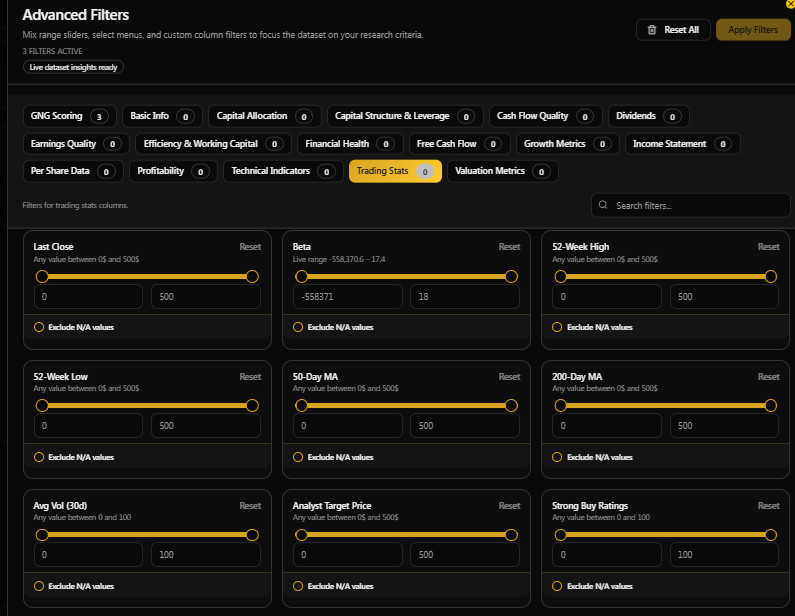
The stock screener is part of the research terminal, which is our first tool.
Our last DK customer survey indicated that 85% of the value of that service was the tools, which is why we’re putting so much effort into making tools even better and more useful.
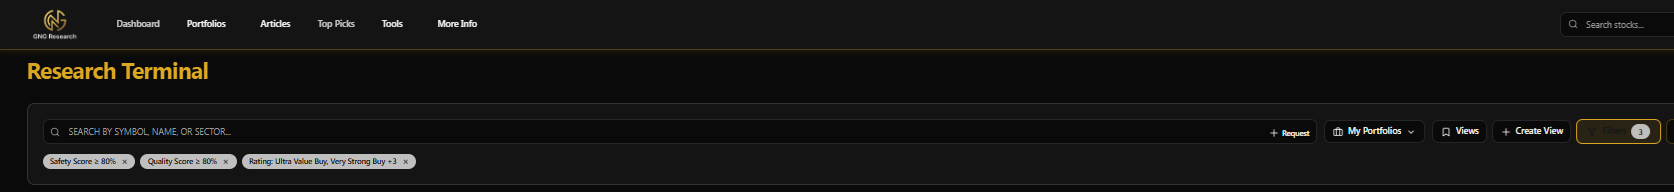
We have a lot of filters, and since this is my first screening article, I’m going to walk you through the options you have on filters and tell you which ones I like and why.
We have 4700 stocks in our system (and 3,000 ETFs!) and putting together the data is complex (there are 2700 total metrics per company) 12.7 million data points that update daily. and if there isn’t sufficient data for a company to generate a reliable safety or quality or valuation rating the system is designed to mark it “NA” which is why I exclude that from every screen.
80% safety and 80% quality is consistent with the old DK generation 4 safety and quality model’s blue-chip, SWAN, and Super SWAN ratings.
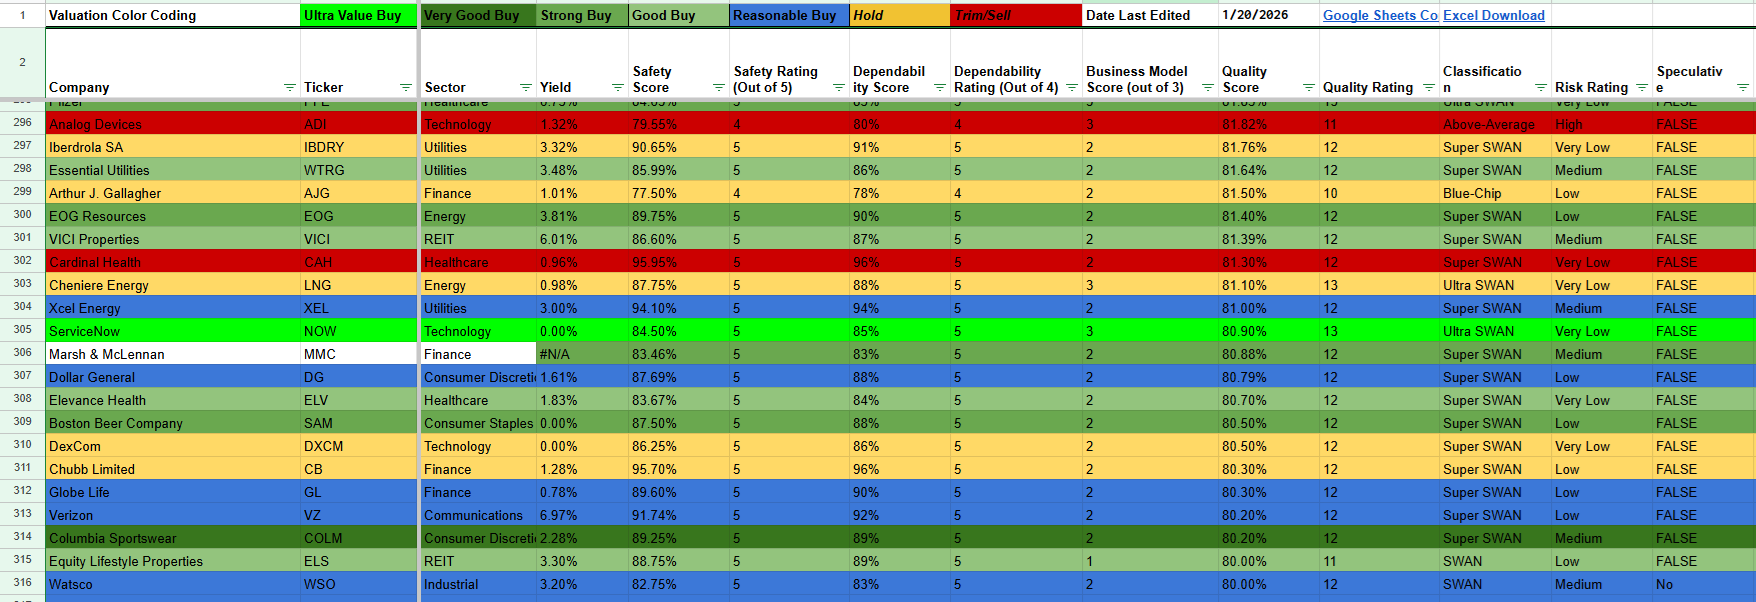
So 80% safety and 80% quality = Verizon, Chubb, Xcel Energy, and Cardinal Health level quality blue-chips
63% of the DK 500 Was This Quality Or Better (a good group made of of all aristocrats, foreign aristocrats, and SCHG, SCHD holdings)
Don’t Forget About Valuation
For some companies, like Philip Morris (where the growth rate is permanently higher and the market is likely to permanently re-rate the PE higher), I’m willing to be a bit speculative and buy and recommend after a careful analysis, including Morningstar and FactSet consensus.
Just like at DK we are using a 12-month forward PE vs historical (10 year median) PE for the official ratings (cash flow for REITs, midstreams).
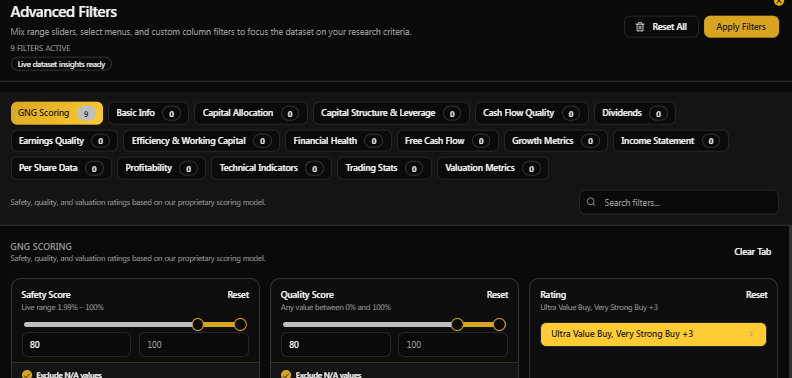
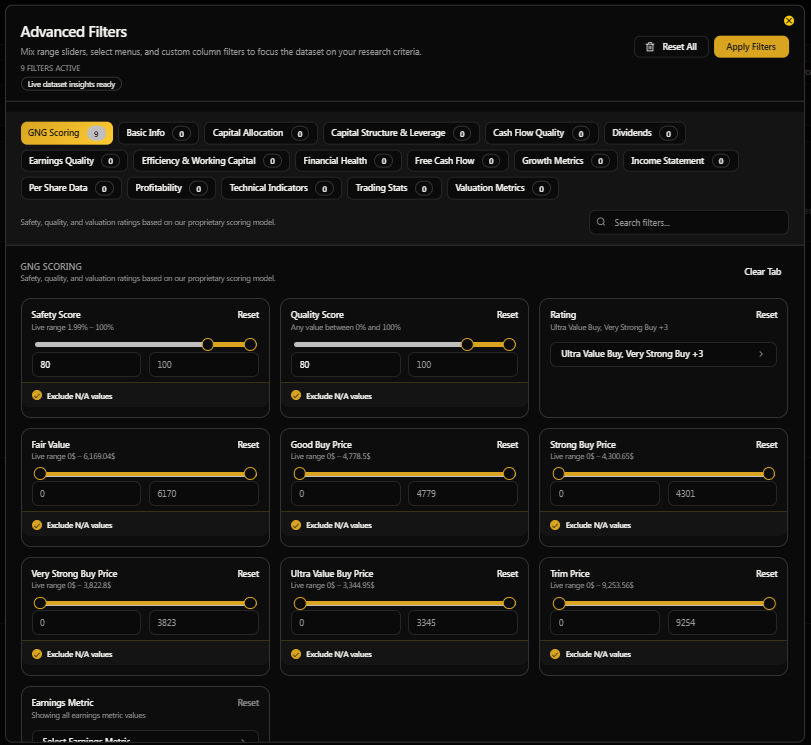
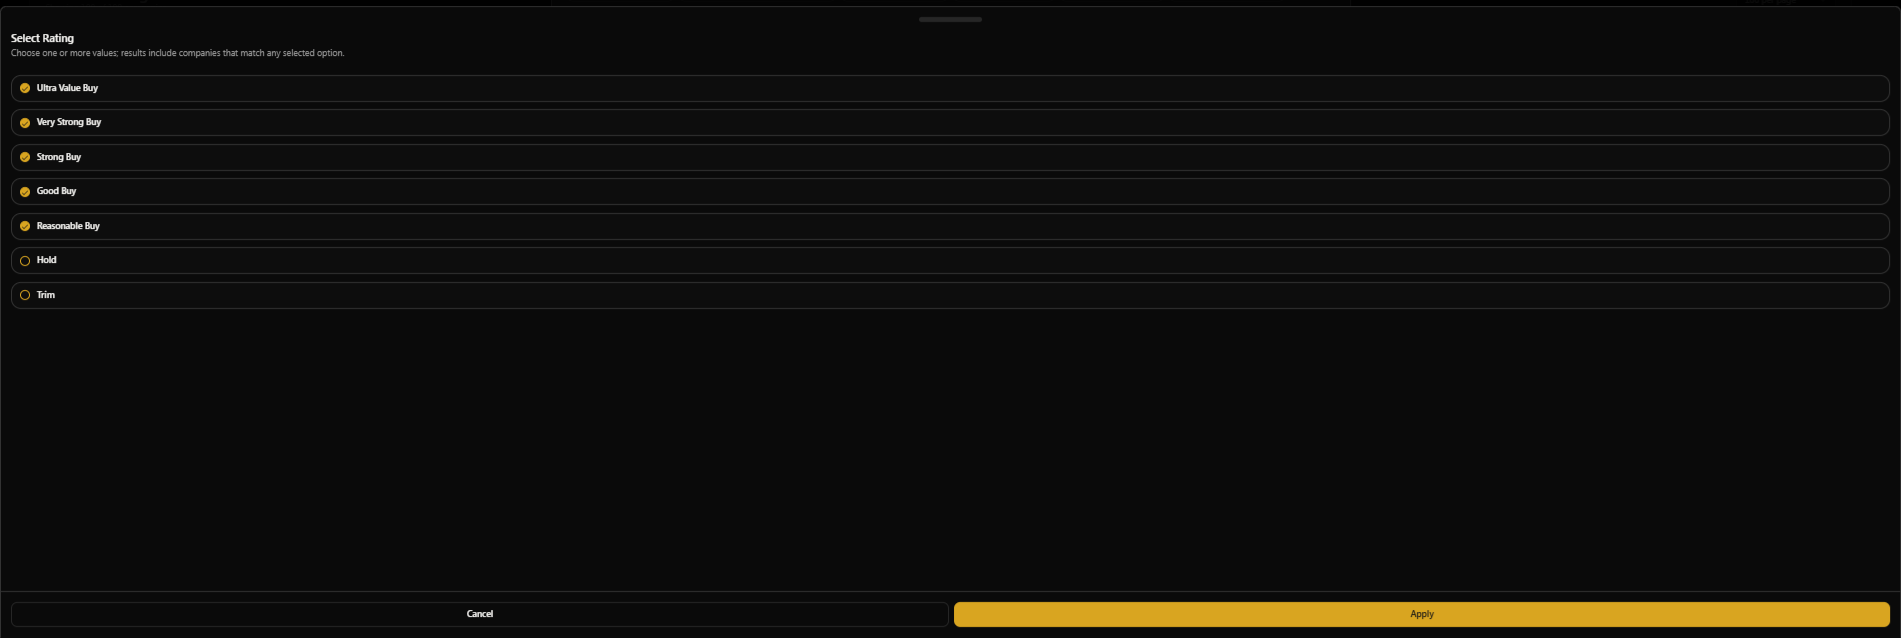
So under “ratings,” I always select reasonable buy or better.
OK, so now we have blue-chip quality (actually SWAN quality and higher) companies, trading at a historical discount to market-determined, objective fair value.
The ratings are based on the safety score.
A 100% safety score company is a good buy at fair value, a 95% safety score company is a good buy at 5% discount, a 90% safety company is a good buy at a 10% discount, ect.
Speculative companies add 5% on top of that.
And a strong buy is 10% higher discount, a very strong buy 20% , an ultra value buy 30%.
For example, a 50% safety company needs a 50% margin of safety to be considered a potentially good buy (though any stock trading at a discount is a potentially reasonable buy).
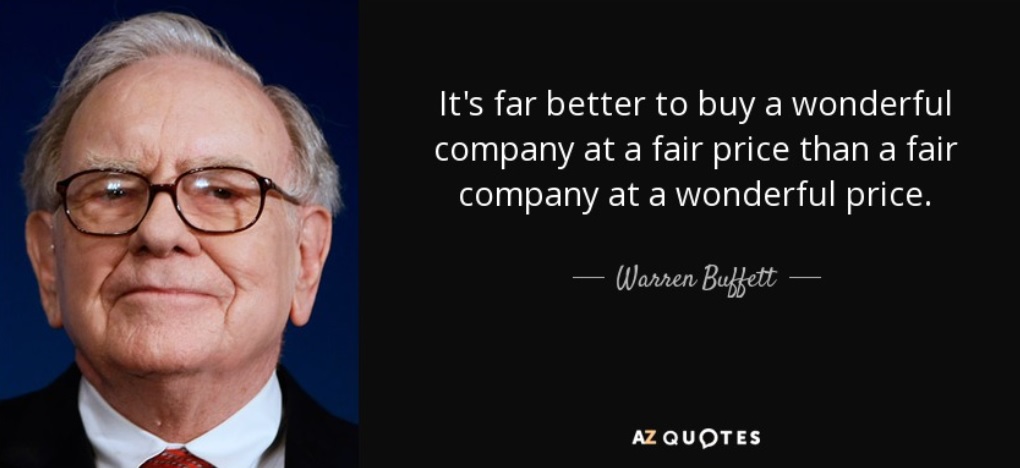
While a company trading at a 100% safety is a classic Buffett-style “wonderful company at a fair price”.
In other words, a 100% safety score company is so high quality that if it’s 30% historically undervalued, that’s an “Ultra Value buy” because over 13 years as a financial analyst, I’ve noticed that Ultra SWANs like this tend to only fall 20% to 40% during their bear markets.
The most undervalued company I’ve ever seen on this valuation methodology was Amazon at a 68% discount at its 2022 lows. EPD at 65% was the most undervalued dividend stock. BTI hit 54% undervalued at its lows (with a PE of 6).
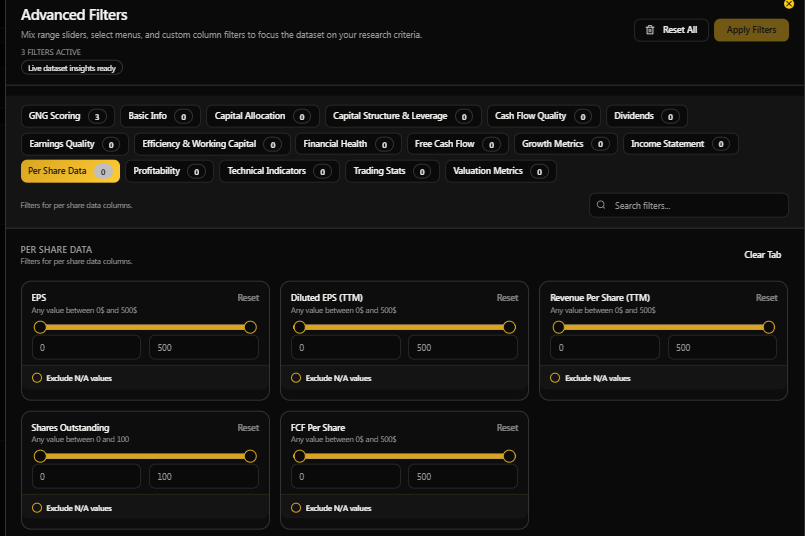
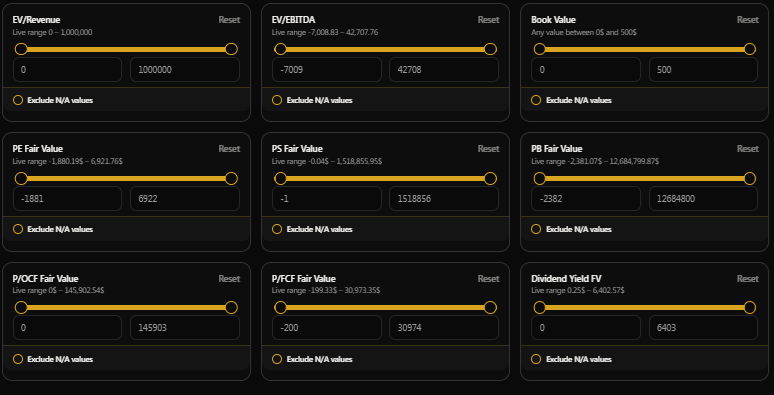
Now The Fun Part! Customizing The Filters!
What can you screen for with the GNG Research Terminal?
187 ways to screen 4700 companies!
DK had 60 ways to screen 500 companies!
NOW can you see why we’re so excited?! 😉
Let’s walk through everything together.
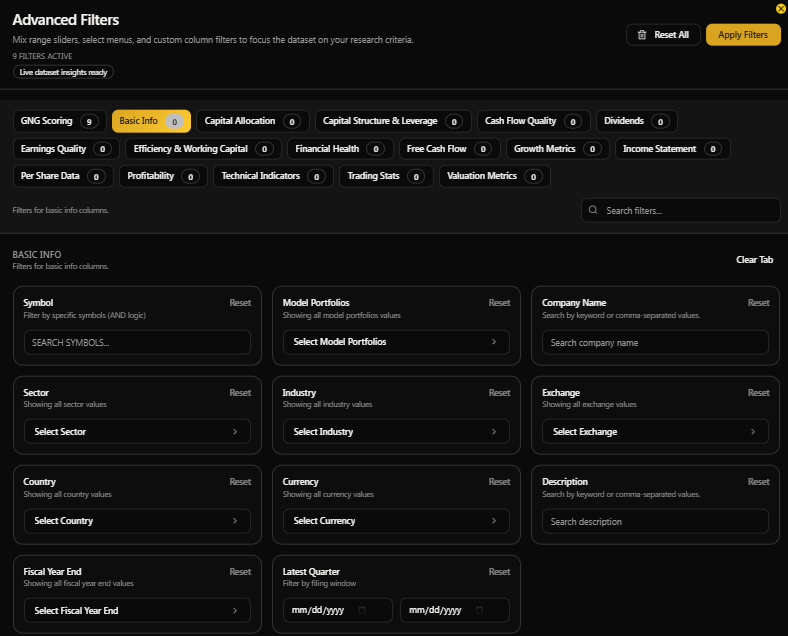
You can screen by country, currency, industry, and sector.
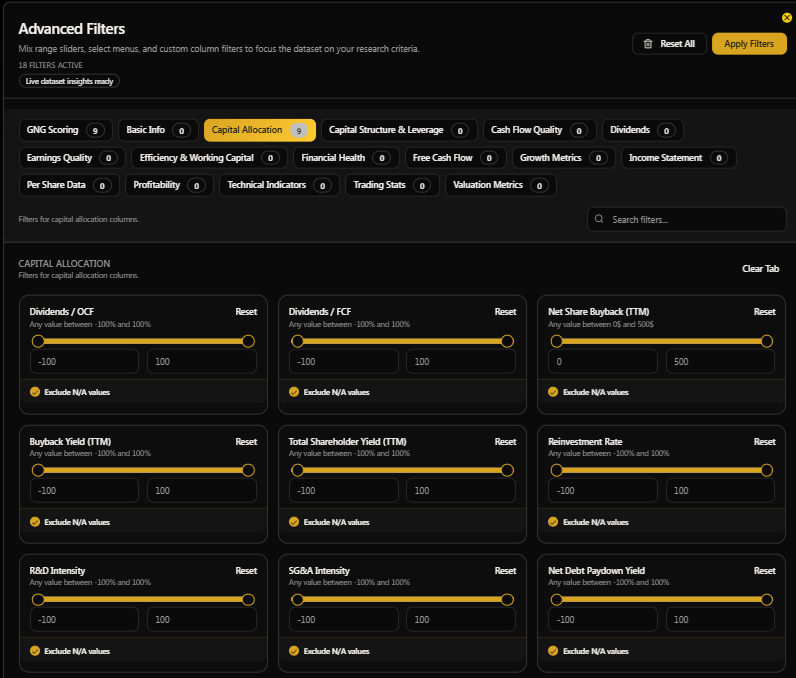
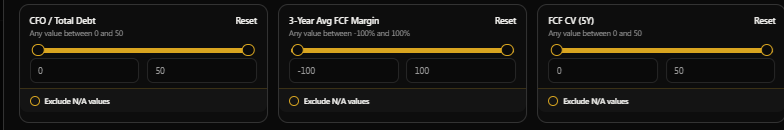
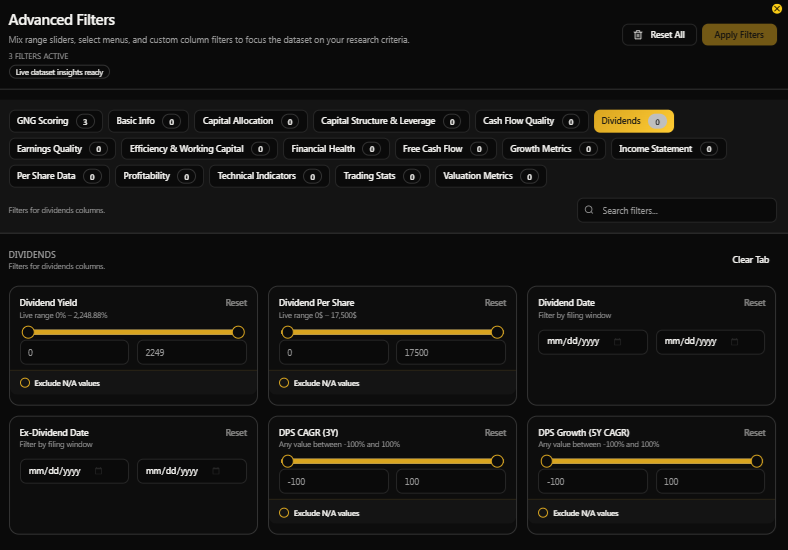
You can screen by dividend payout ratio for operating cash flow (for utilities, REITs, and midstream, for example) or FCF (for most companies), and even buyback and total shareholder yield (buyback + dividend yield).
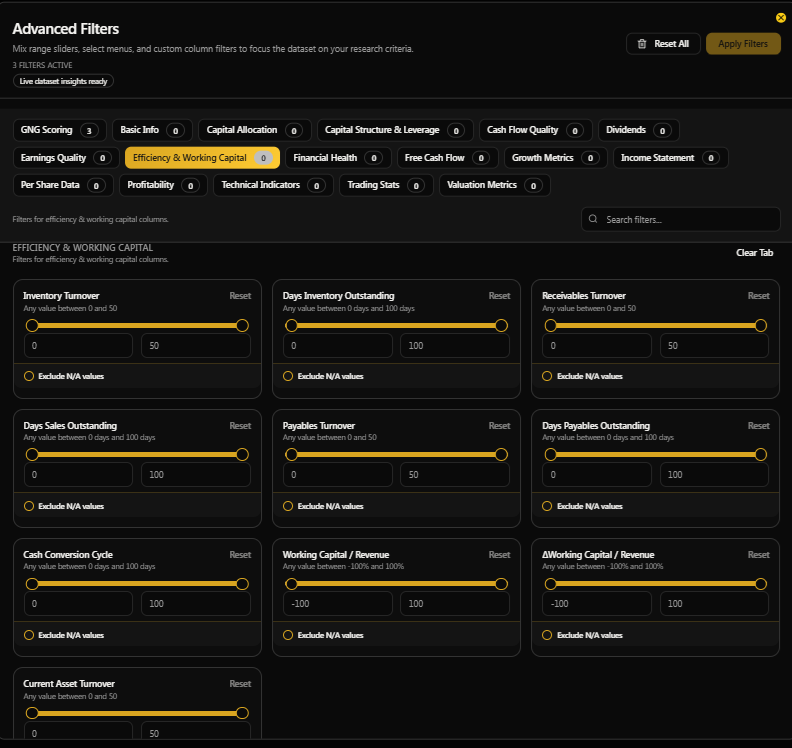
You can really get into the weeds with the new system settings!
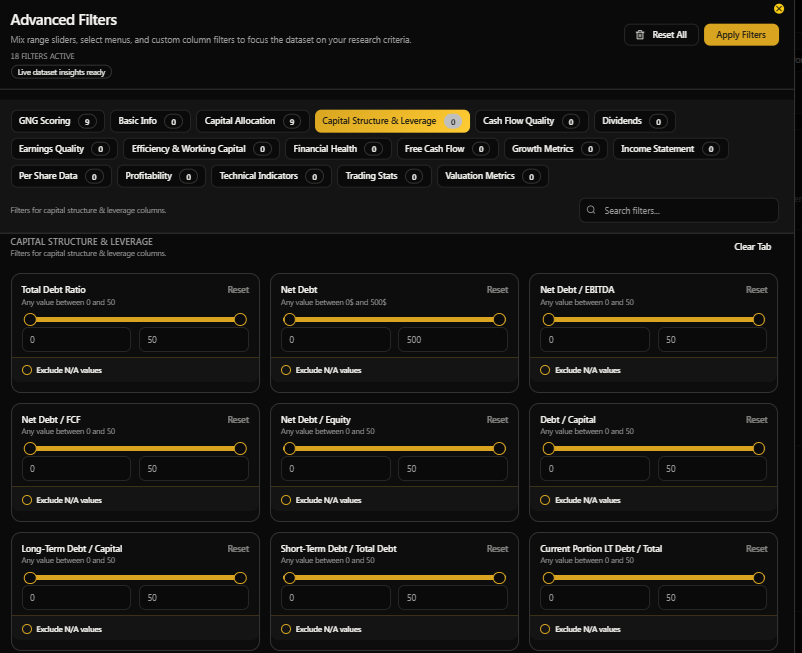
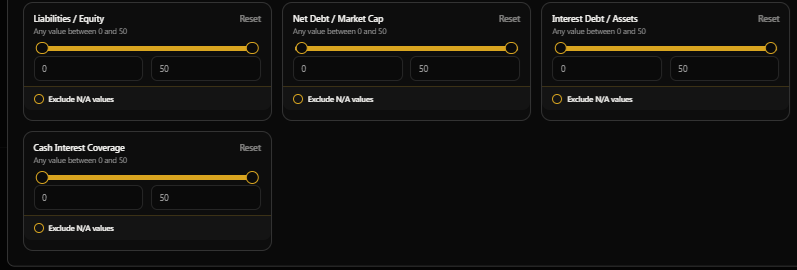
If you don’t like our safety and quality model (version 6 with version 7 coming in 2027), you can even use your own criteria for things like debt ratios.
These kinds of “in the weeds” screening options are great if you’re a professional analyst looking at companies with specific metric criteria, like when S&P says they might upgrade company X if the debt/EBITDA falls below Y within the next 2 years.
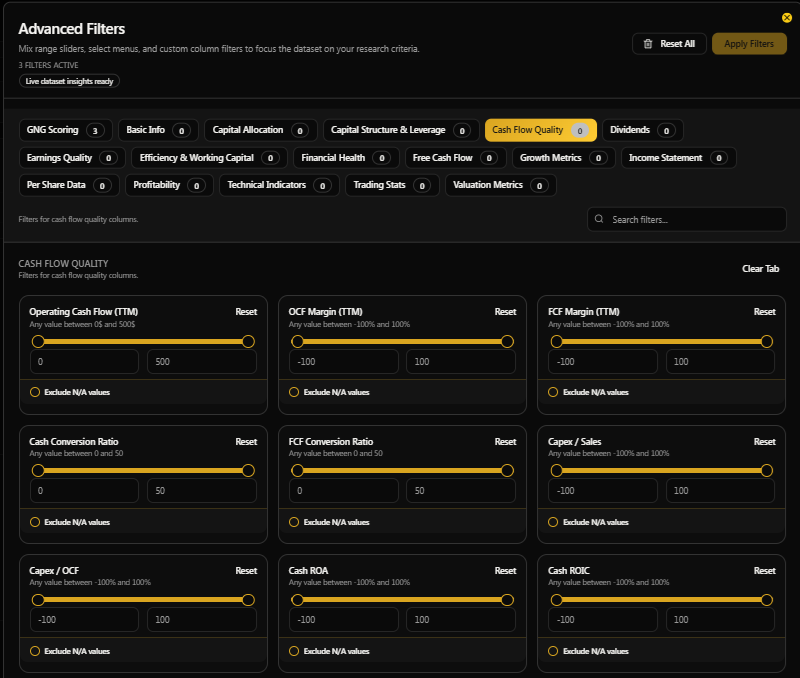
My screens won’t get that in-depth, though I love that we can screen by FCF margin!
Screening By Yield & Dividend Growth Rates!
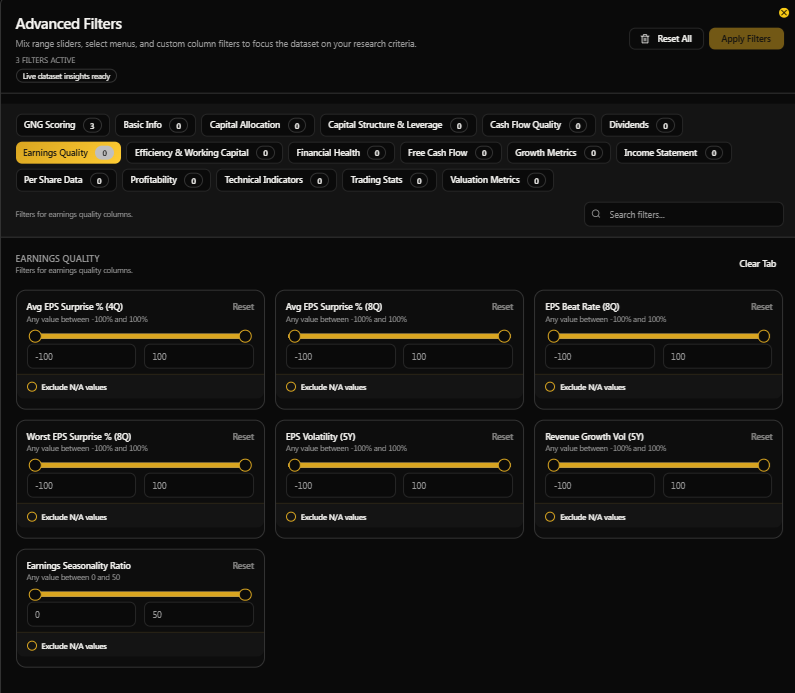
Earnings Quality Screening Is Some Tom Lee Level Nerdiness😉😂
We’re Building GNG For All Levels Of Investors, Including Institutions
Advanced Accounting Fraud & Bankruptcy Prediction Metrics Like Z, M, and F Scores!
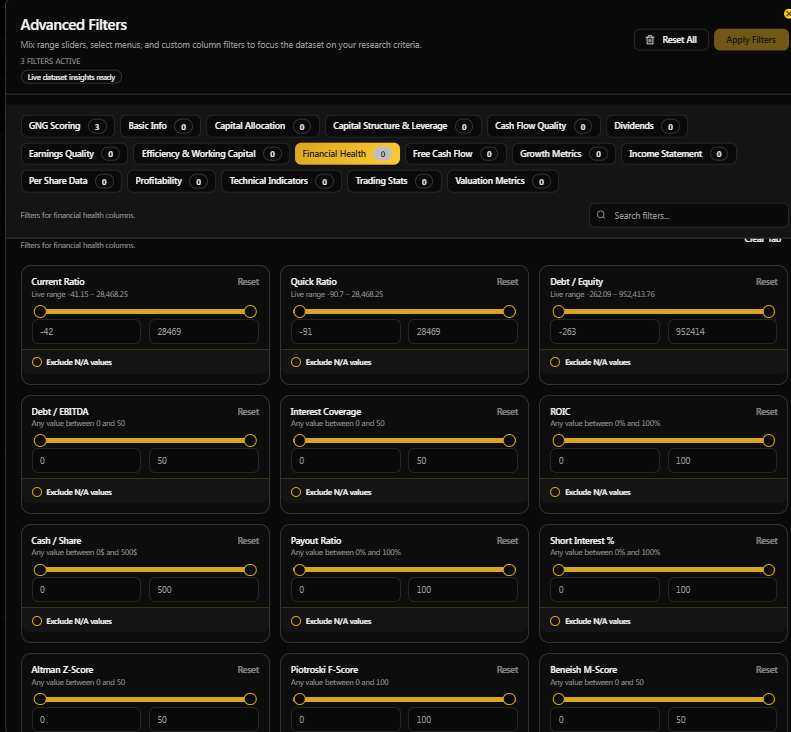
DK, at one point, had the advanced safety metrics as screenable, but since I had to manually update them each quarter, that was not an option for 4,700 companies. But thanks to the wonders of automation and Connor’s 1.1 million lines of code (and counting!), we now have them!
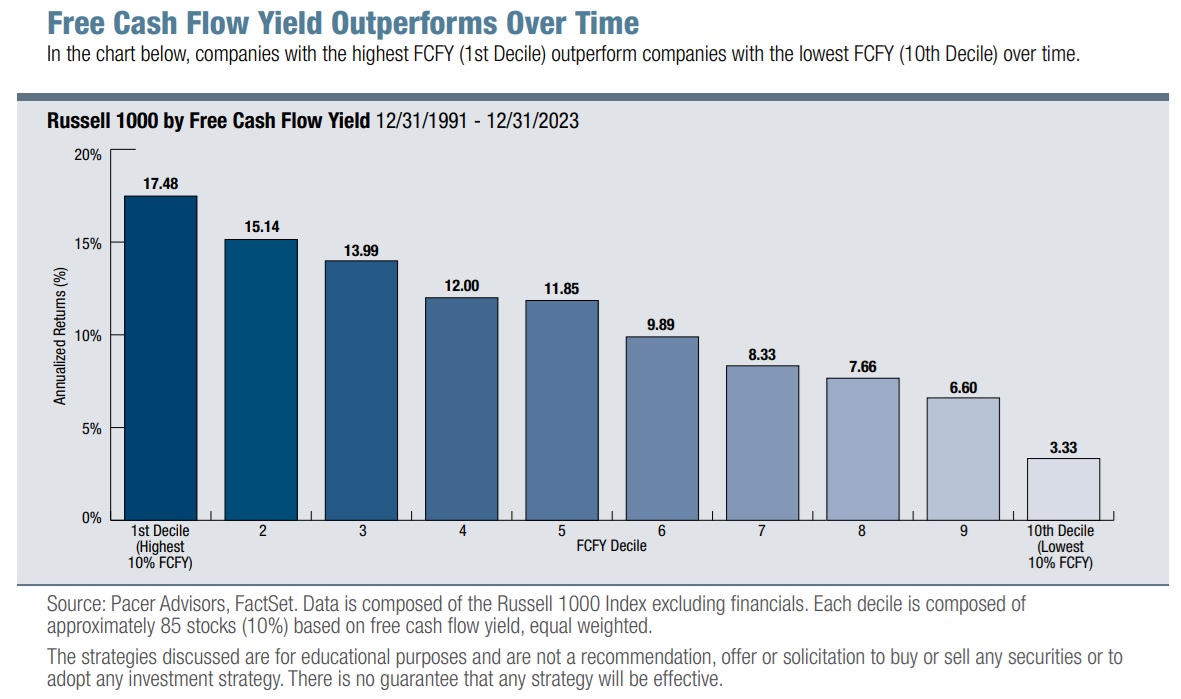
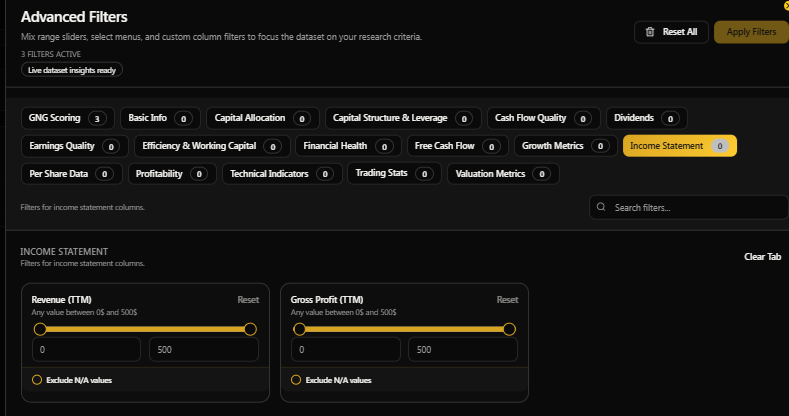
You can Now Build Your Own VFLO!
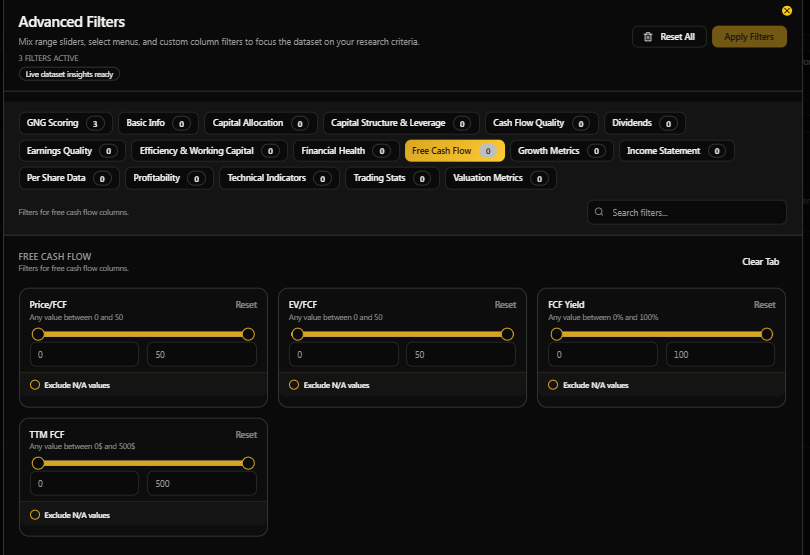
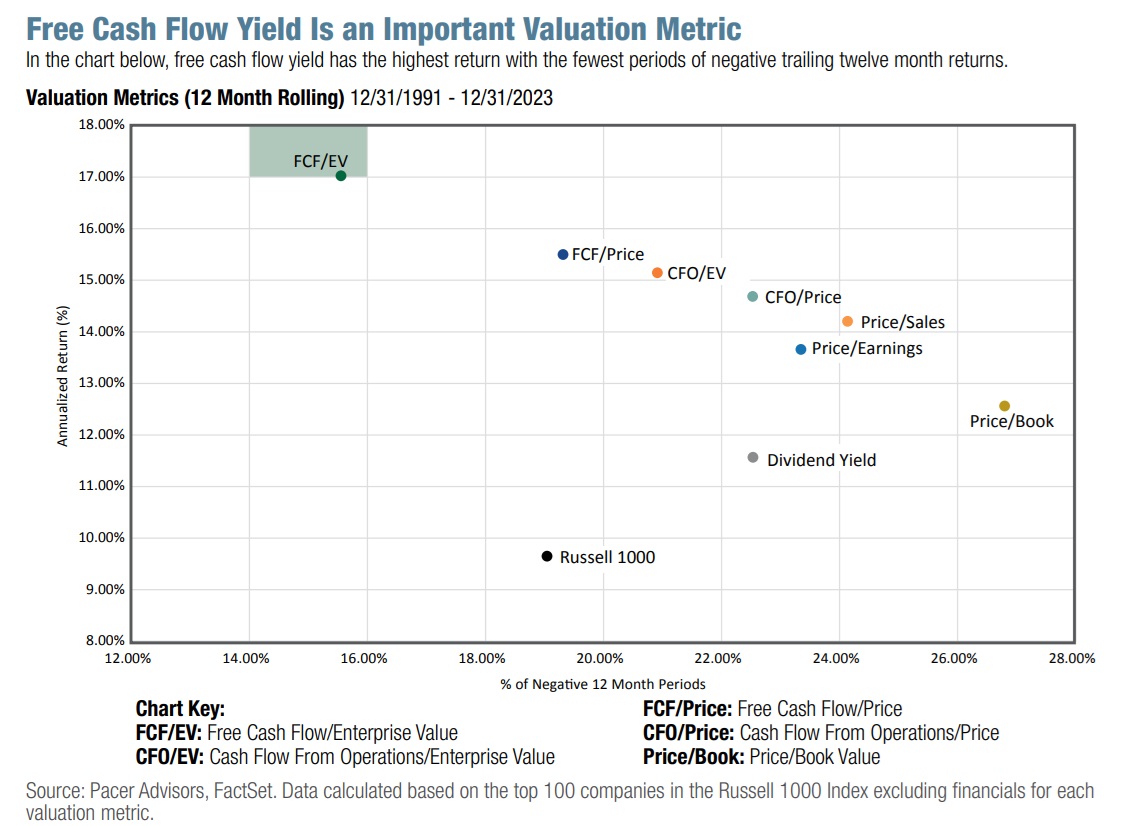
EV/FCF is the best-performing valuation metric since 1991. Value stocks never stopped working, as long as you were measuring the valuation correctly.
And now you can screen by EV/FCF! Remember how I keep saying, “It’s always and forever a market of stocks, not a stock market”?
The market of stocks, not a stock market, is from my former colleague Chuck Carnevale.
I added “Always and forever” because I’m nerdy and like dramatic flourishes, and it’s also true😉😂
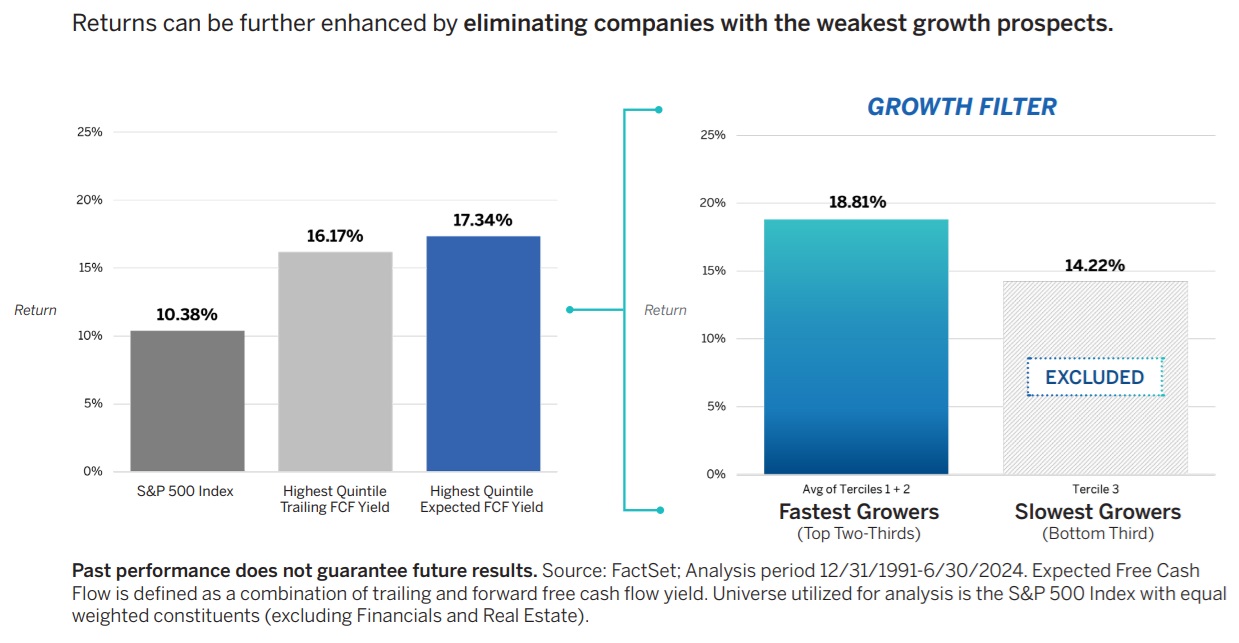
Screening By Growth Rates…Just How VFLO Improved On COWZ!
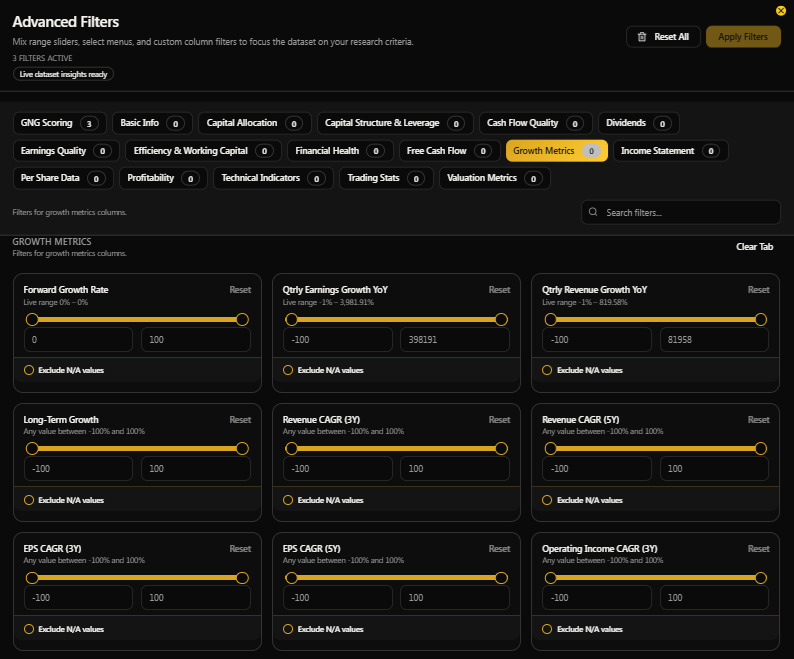
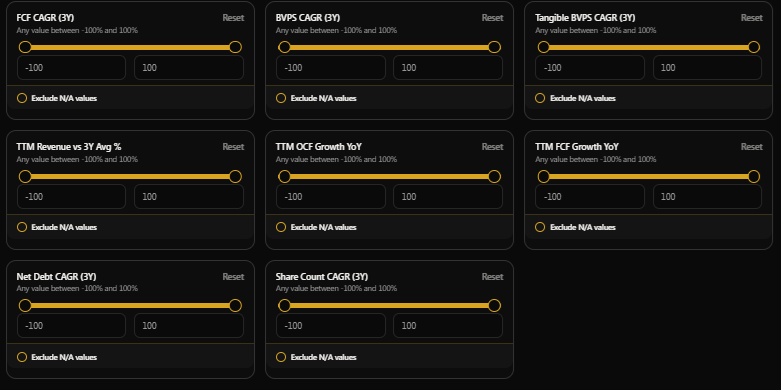
The reason that VFLO is better than COWZ is that it takes the same basic approach, and then screens out the 33% slowest growing companies, using both trailing and forward growth rates (consensus estimates).
You can bet that I will do exactly this, creating a GNG FCF Yield article in the future, because this is such a wonderful way of finding really high-quality investing ideas.
When we do our ETFs (like PEGY or a quality-adjusted VFLO) we’ll have fully automated versions with optimized risk rules as well.
Like how VFLO has 4% max risks caps and 20% sector risk caps.
We’ll get our neural networks optimizing the ETF's risk caps and risk rules to deliver the best balance of safety and returns.
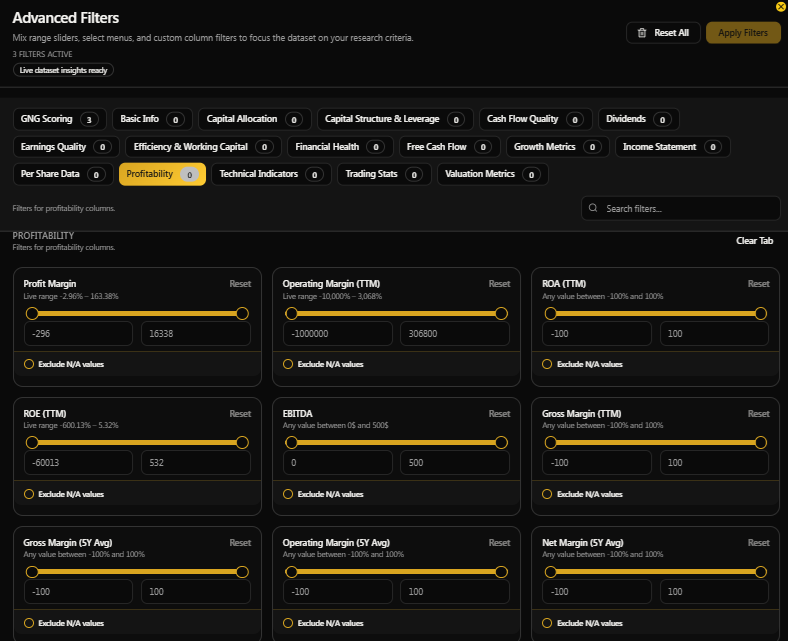
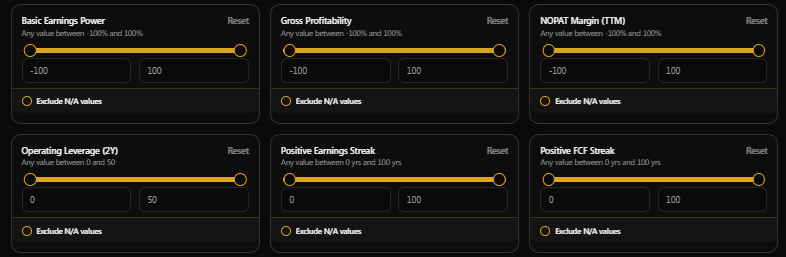
Profitability Is Wall Street’s Favorite Quality Proxy…Now You Can Create Your Own Quality ETFs!
Technicals For the Traders Among You (Or Quandamental Investors Who Combine Fundamentals With Quantitative Metrics Like Glenn)
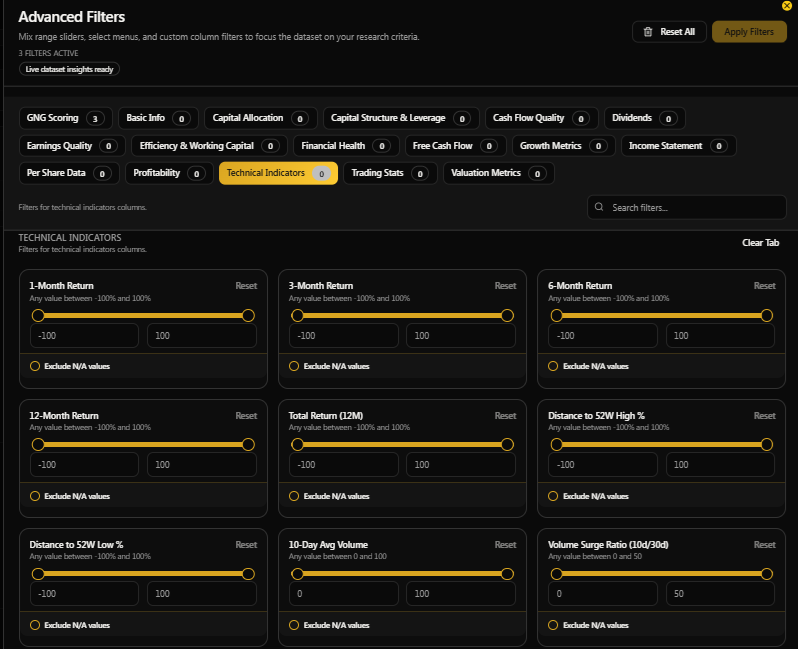
RSI is the one I’m most excited about, because 80+ indicates overbought and potential reversal
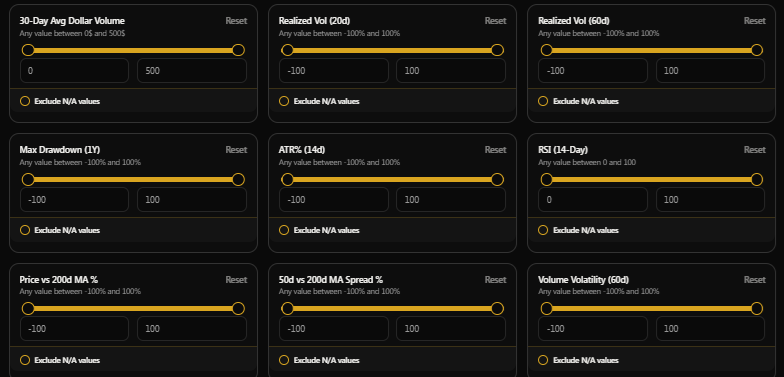
More Technicals But I Like Being Able to Screen by Beta (Perfect For Investors Like Me Who Are Trying To Control Volatility
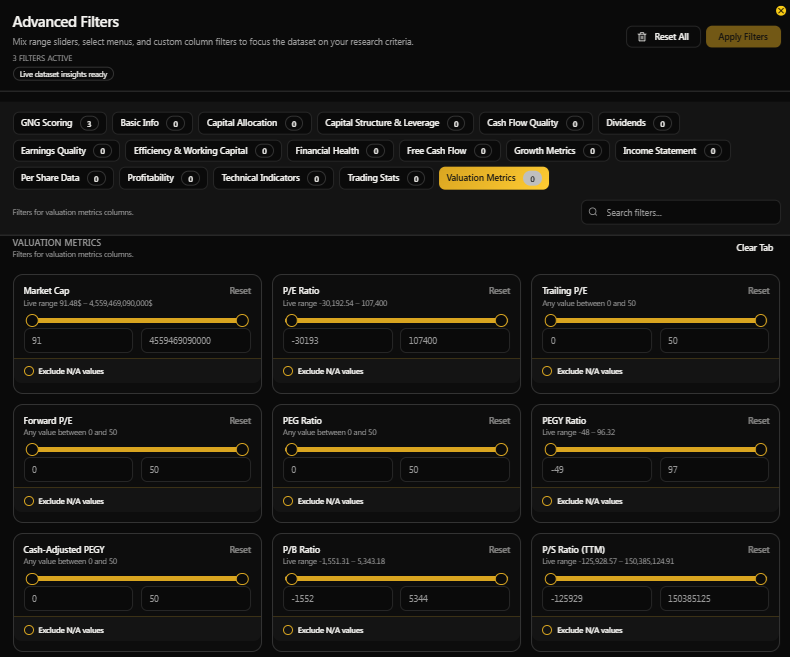
“I Never Pay More Than 15X Earnings For A Company Because That’s What Ben Graham Did”? or “I never buy a stock with a PEG above 1 because that’s what Peter Lynch Did” And PEGY Ratio! Value investing nerdgasm!😉😂
Part 2 Coming On Wednesday, January 28th
See everyone after the Wedding! I have to get going to the Doctor’s, so thank you for your patience and understanding.
I’ll be doing the Ultra ZEUS V2 screening and optimization and do that report after I get back, AFTER I finish part 2 (and possibly part 3).
Bonus Meme!
I asked Nano Banana 2 to give me another “Age of AI” meme similar to the one I created.