Portfolio Tracker
Free dividend and stock portfolio tracker
Track your dividends without a spreadsheet: add trades by hand or from a CSV, and GNG fills in the payments, income by month, and upcoming pay dates.
Free with a free GNG account. Pro Lite and higher add read-only brokerage linking.
You must be logged in to view this page. Log in or create a free account.
Free to join. No credit card. Takes seconds.
Overview
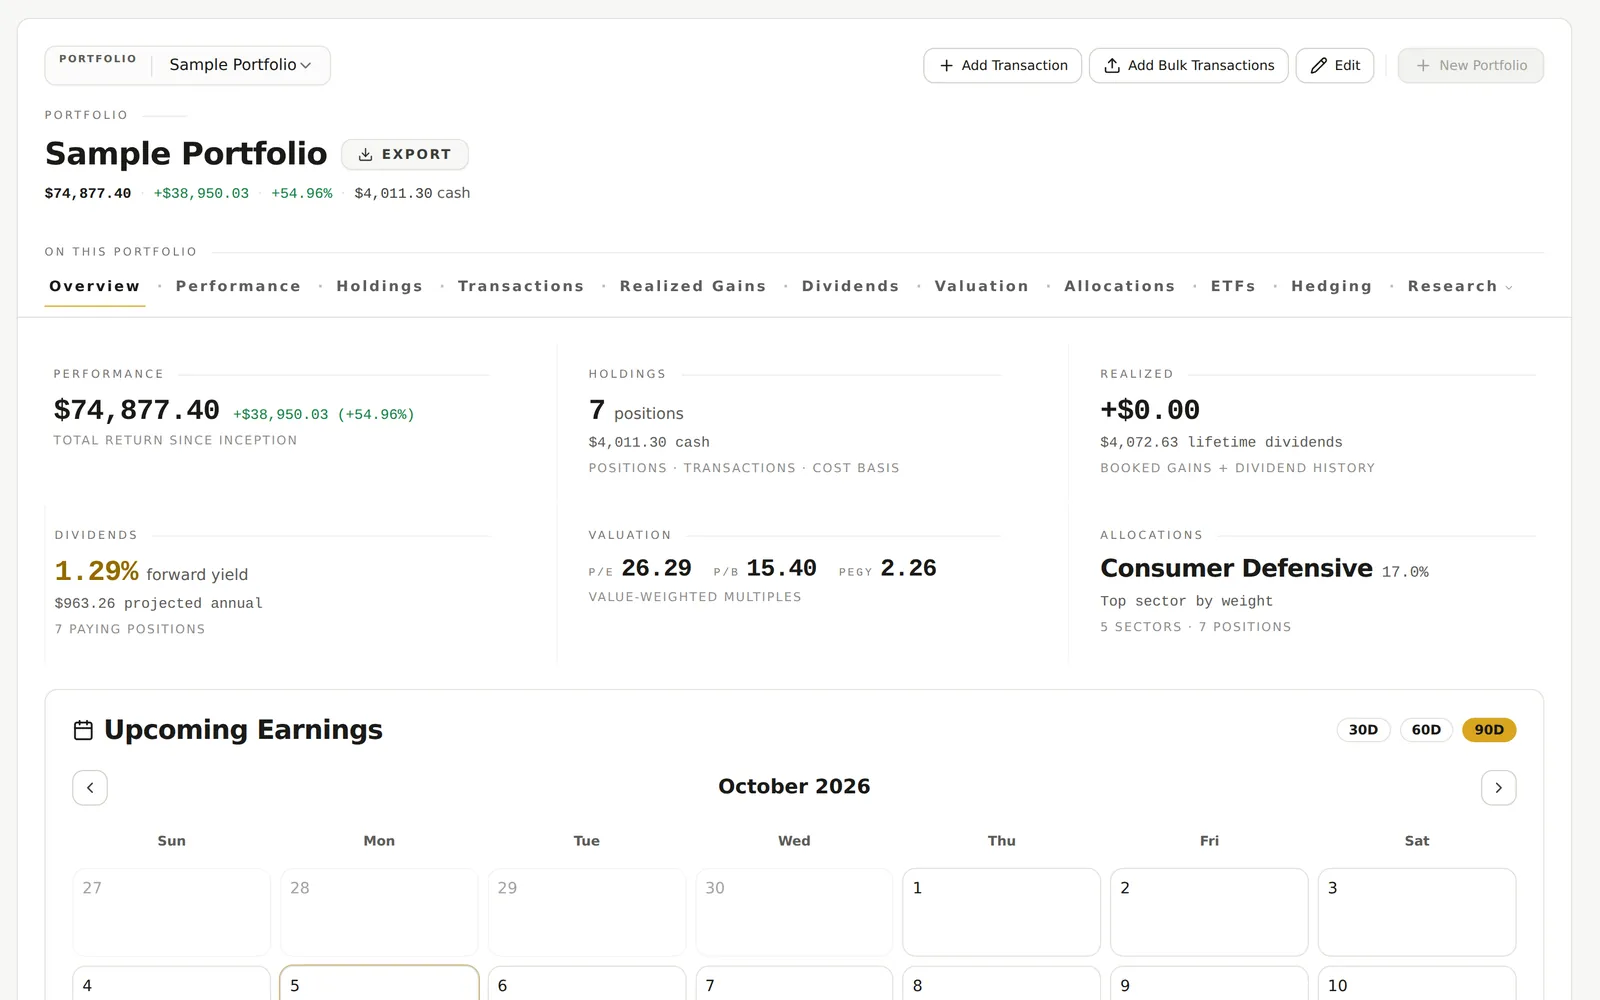
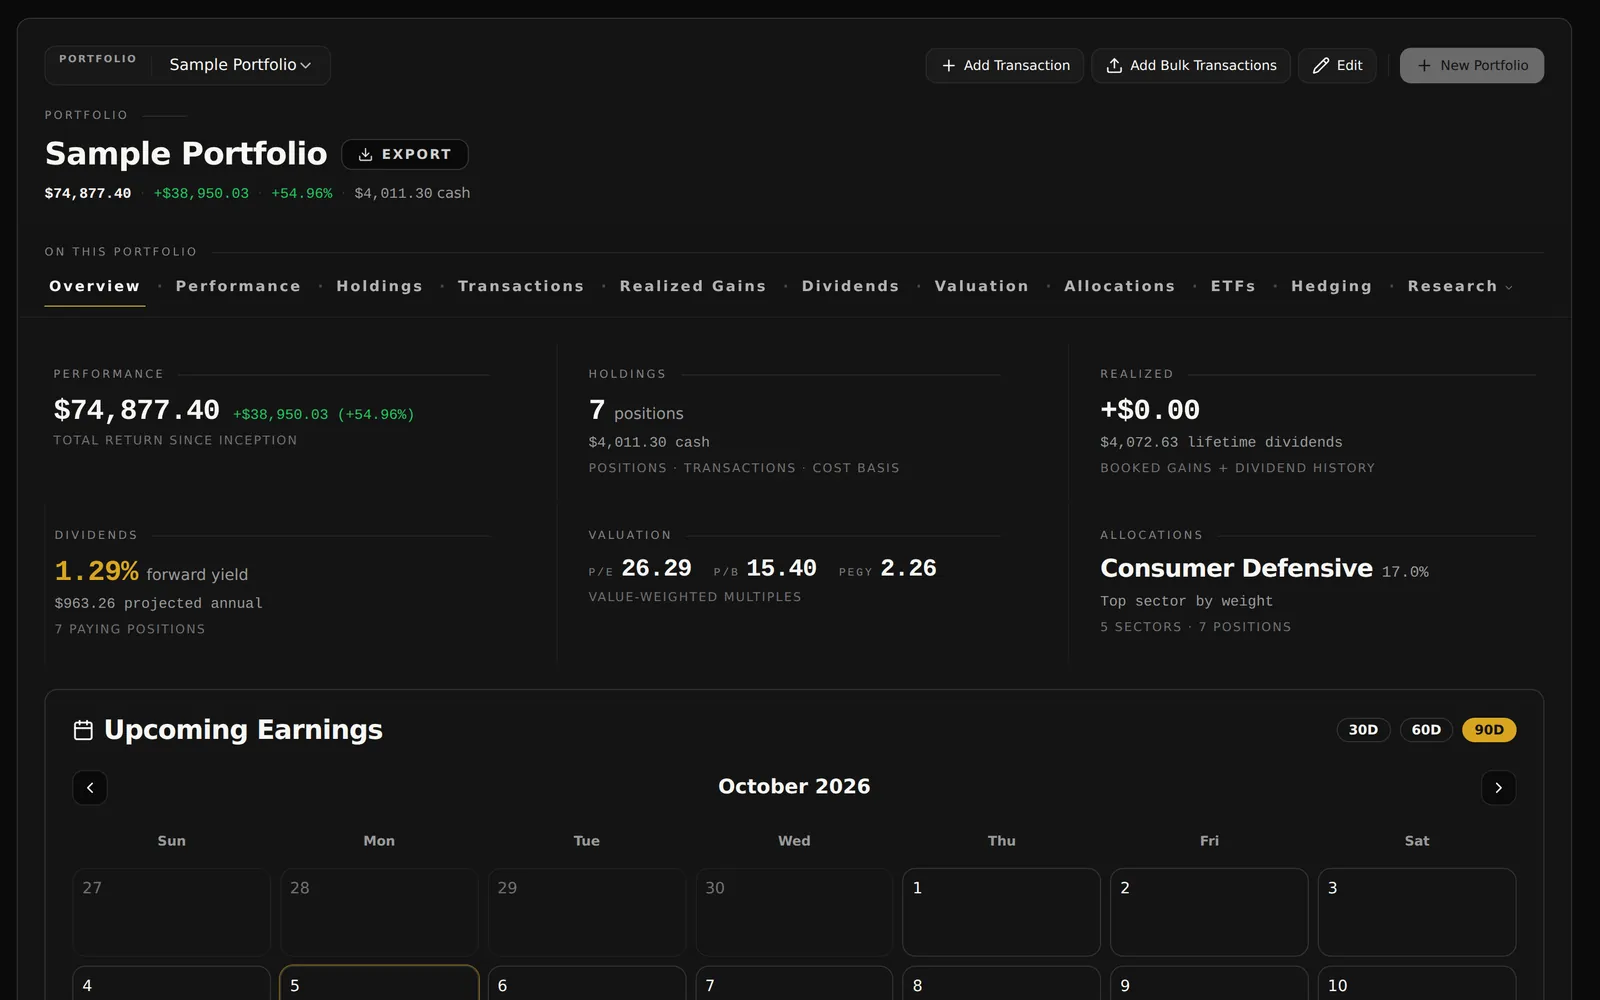
The GNG Portfolio Tracker is a free dividend portfolio tracker that also tracks your stock returns, all in one workspace. Enter buys, sells, deposits, and withdrawals by hand or import them from a CSV file. GNG then fills in the last five years of dividends from each holding's dividend history and the shares you held on each ex-dividend date, so you can track dividends without typing in a single payment.
Track dividend income on the Dividends tab: forward 12-month income, yield on cost, lifetime dividends received, and income growth from the year before. A monthly chart separates dividends received from projected income, and a dividend calendar lists each ex-dividend date, pay date, and estimated payment for the next 90 days, marked declared or projected.
Beyond dividends, compare returns with a benchmark you choose, review realized gains, see sector and position weights, look through ETFs to the stocks they hold, and combine selected portfolios. Pro Lite adds read-only brokerage linking and hedge analysis, and you can ask GNG Analyst about the accounts you allow it to use.
What you get
- Dividends tracked automatically from your holdings
- Monthly dividend income, received and projected
- Dividend calendar of ex-dividend and pay dates
- Yield on cost, payout ratio, and growth streaks
- CSV import to replace your dividend spreadsheet
- Benchmarks, realized gains, and ETF overlap
Inside the tool
Performance vs SPY
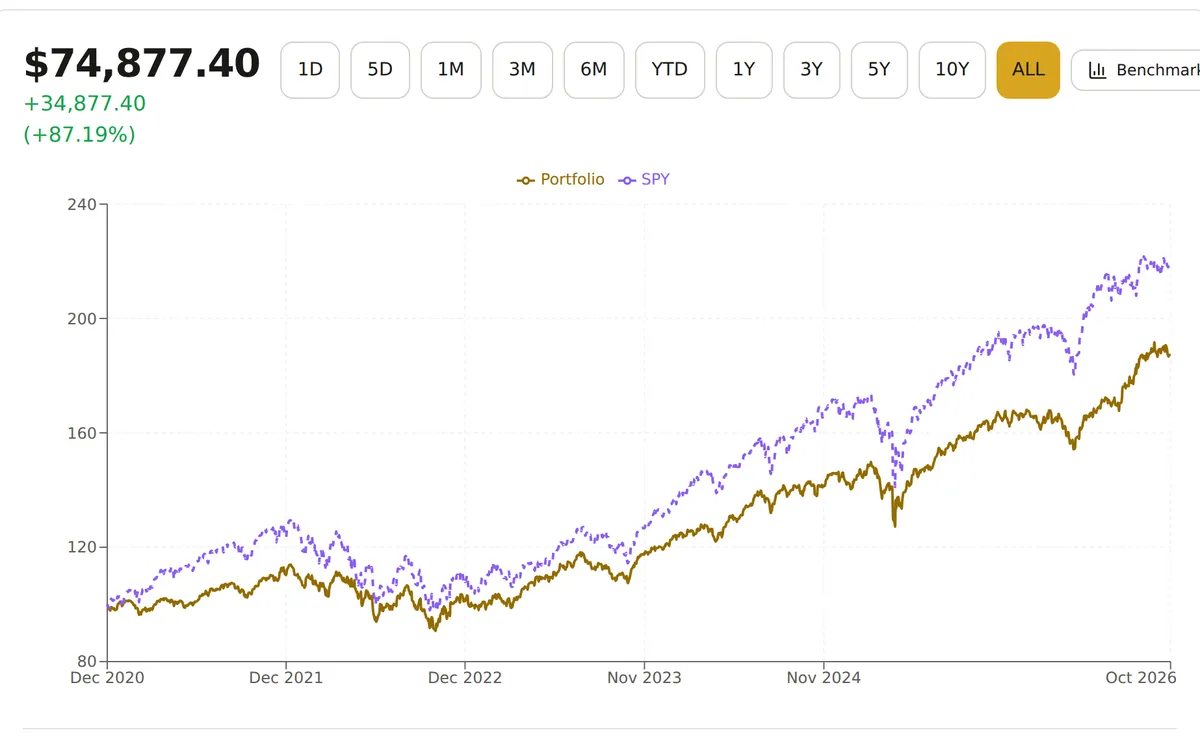
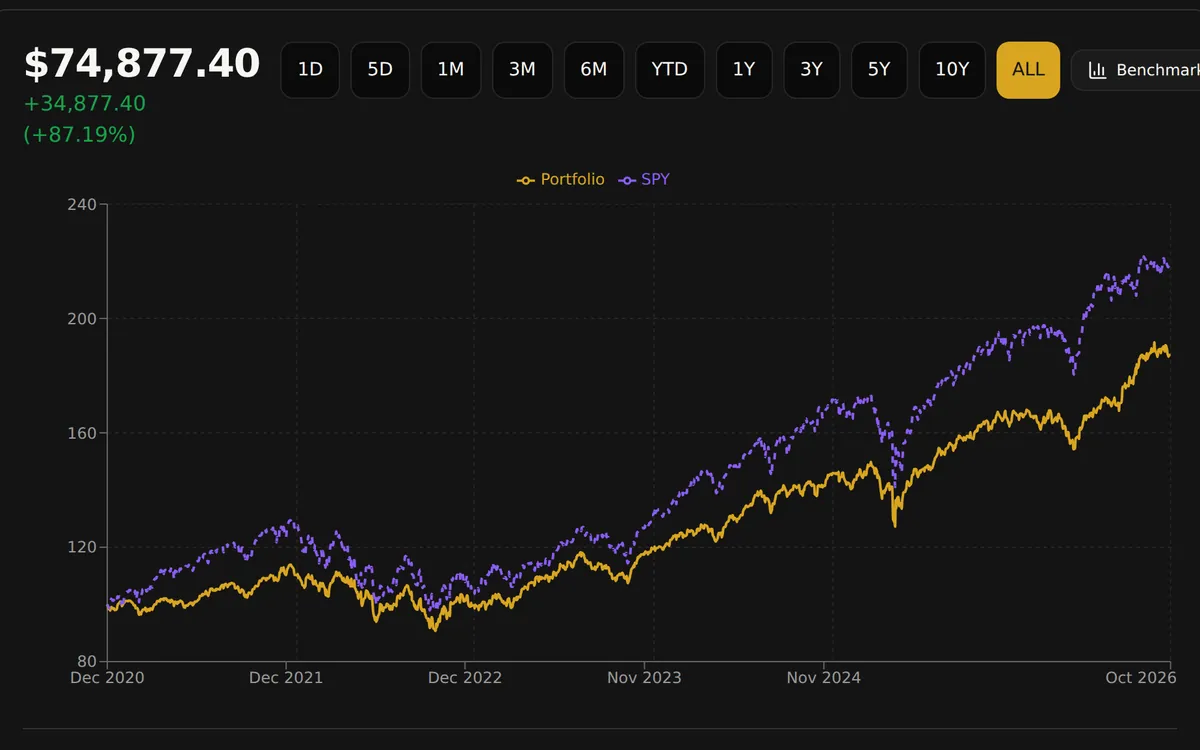
Track the portfolio against a benchmark over any range, from one day to the full history.
The performance chart places the sample portfolio beside SPY over the same window. Switch the range from one day to the full history, or choose another benchmark, to put your results in context. Total return counts the dividends you received as well as price changes, so an income portfolio is not judged on price alone.
- Compare portfolio and benchmark paths
- Move between recent periods and full history
Dividend income ahead
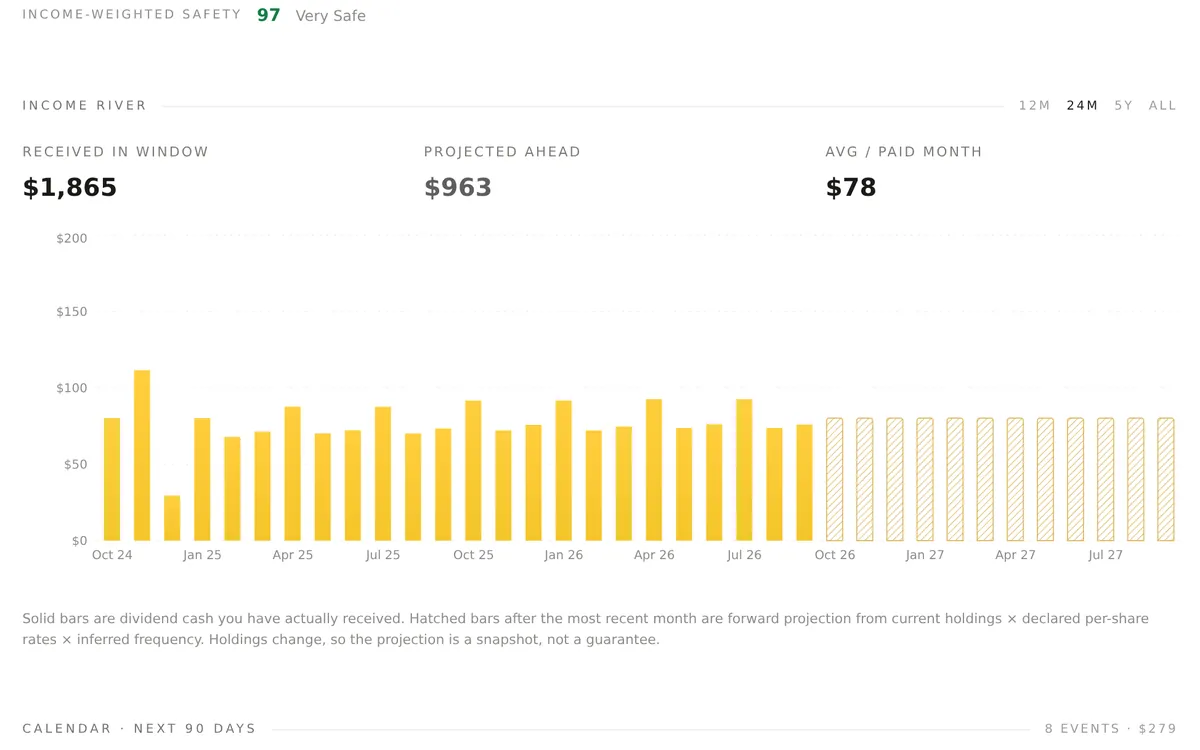
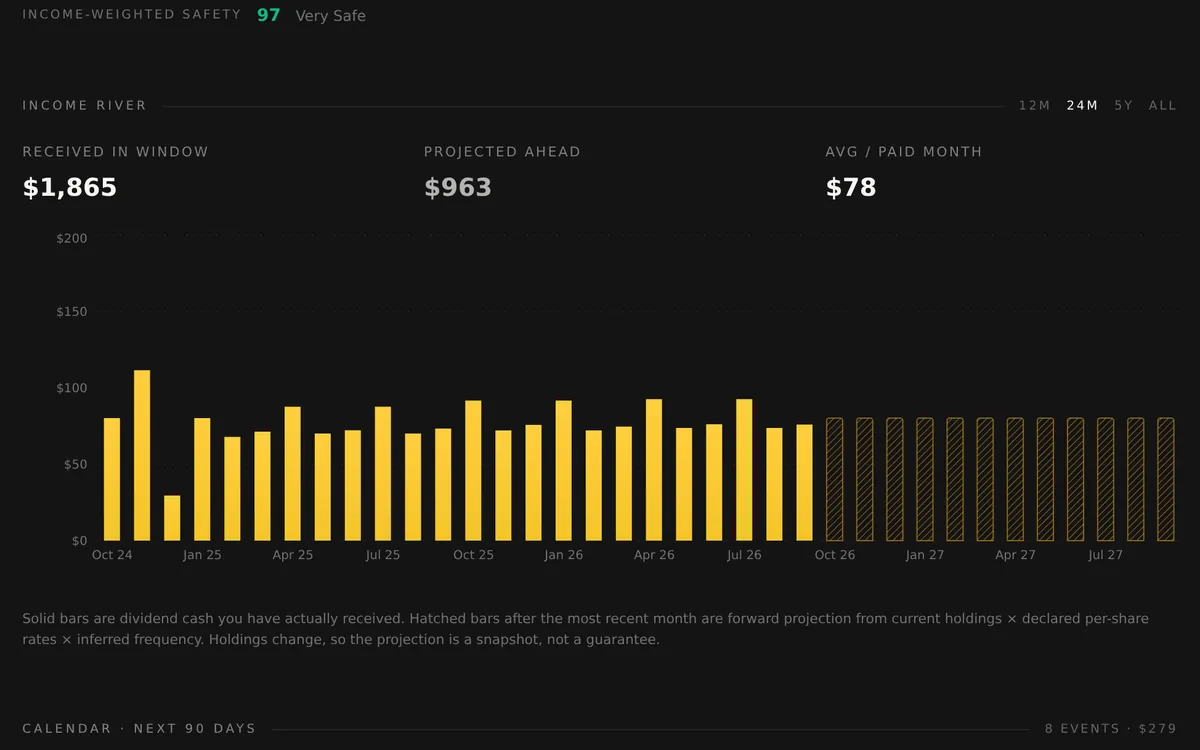
See dividends received month by month and a projection of the income your holdings should pay next.
See your dividend income month by month: solid bars show dividends received and hatched bars spread the next 12 months of projected income from your current holdings. Totals for the selected window show cash received, projected income, and the average paid month. Projections are estimates, so they change when holdings change or a company raises, cuts, or declares a dividend.
- Separate dividends received from projected income
- Check upcoming ex-dividend and pay dates in the dividend calendar
Sector and position mix
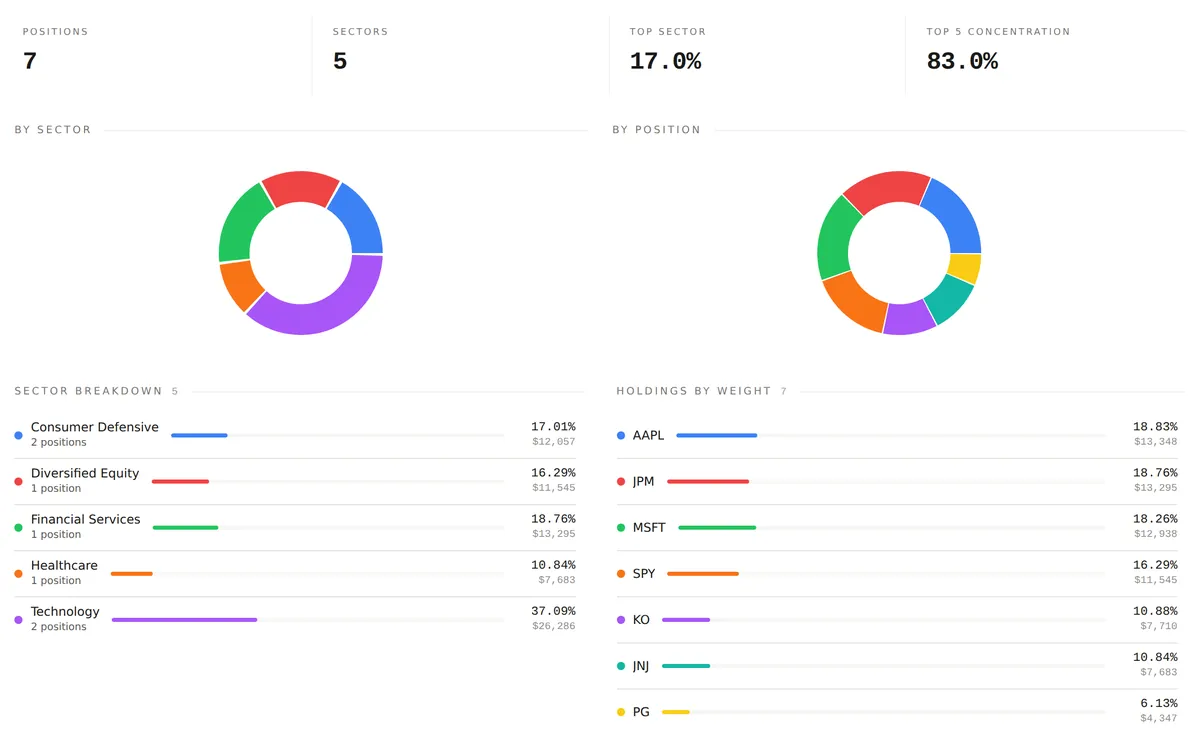
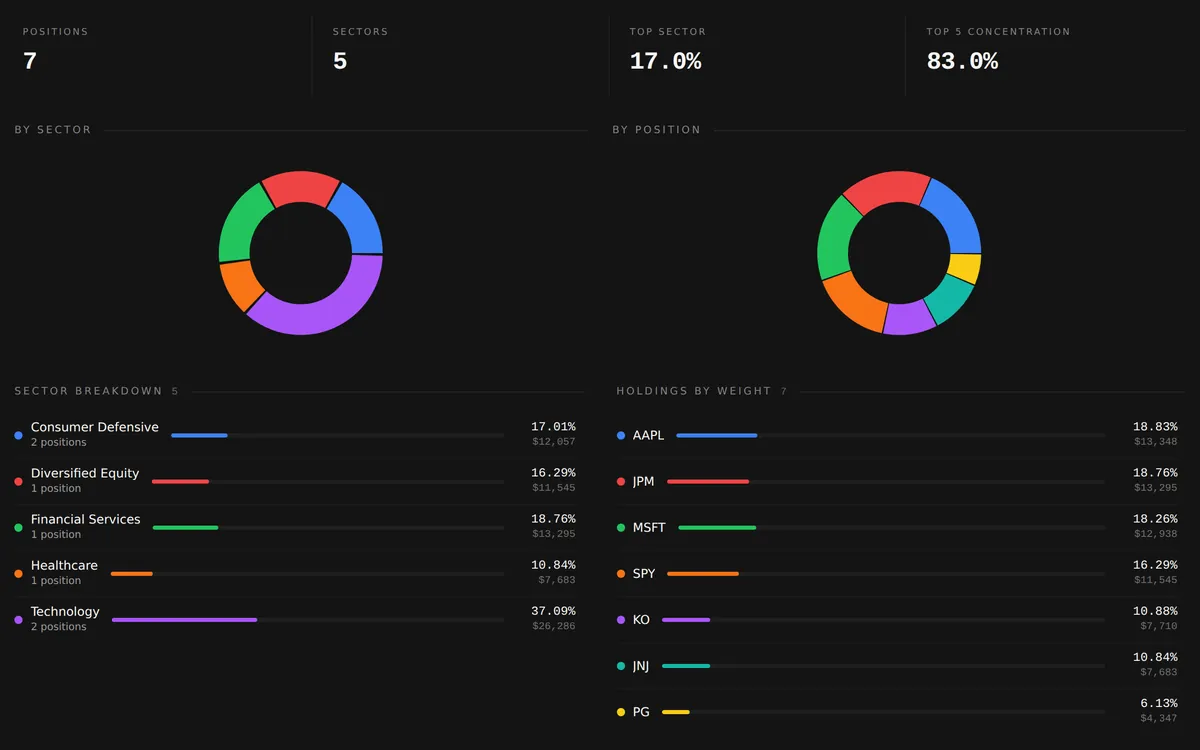
Break the portfolio down by sector and by position, with weights and dollar values.
The allocation view breaks the sample portfolio into sectors and individual positions. Charts sit beside ranked lists with weights and dollar values, so you can spot the holdings and sectors that carry the most exposure. The Dividends tab adds the same split for income, showing which sectors pay you the most.
- Review sector weights and dollar exposure
- See each position as a share of the portfolio
Holdings at a glance
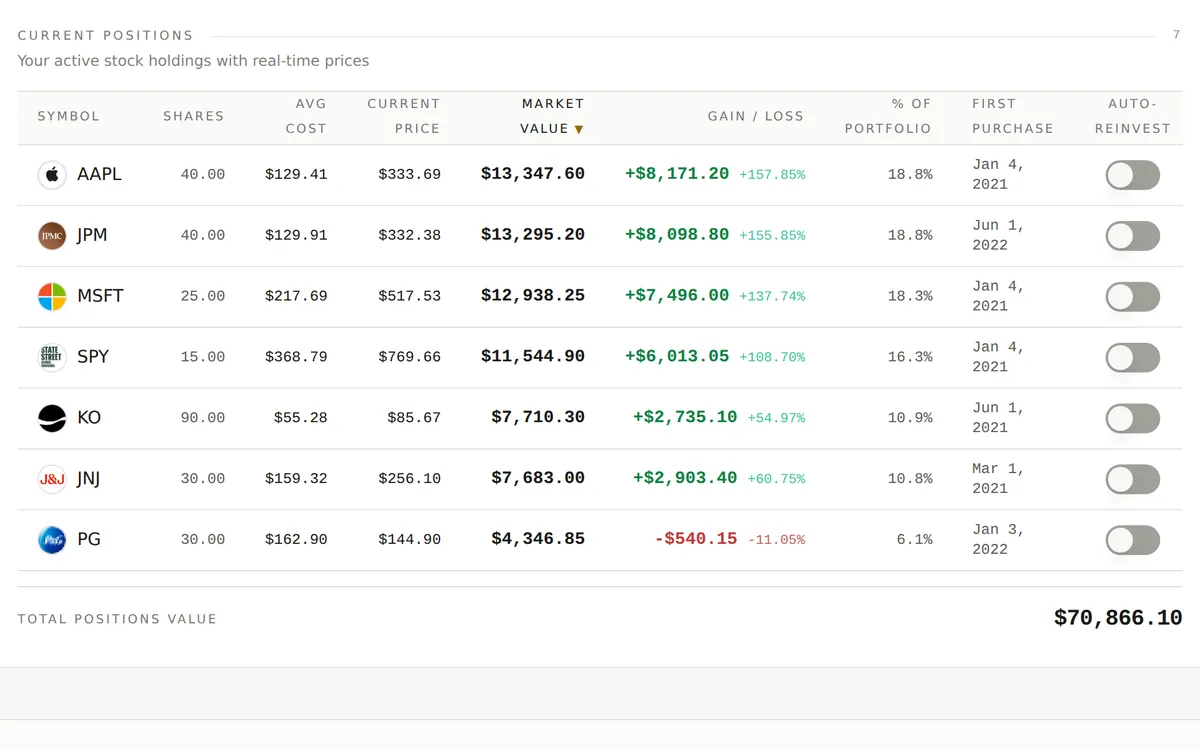
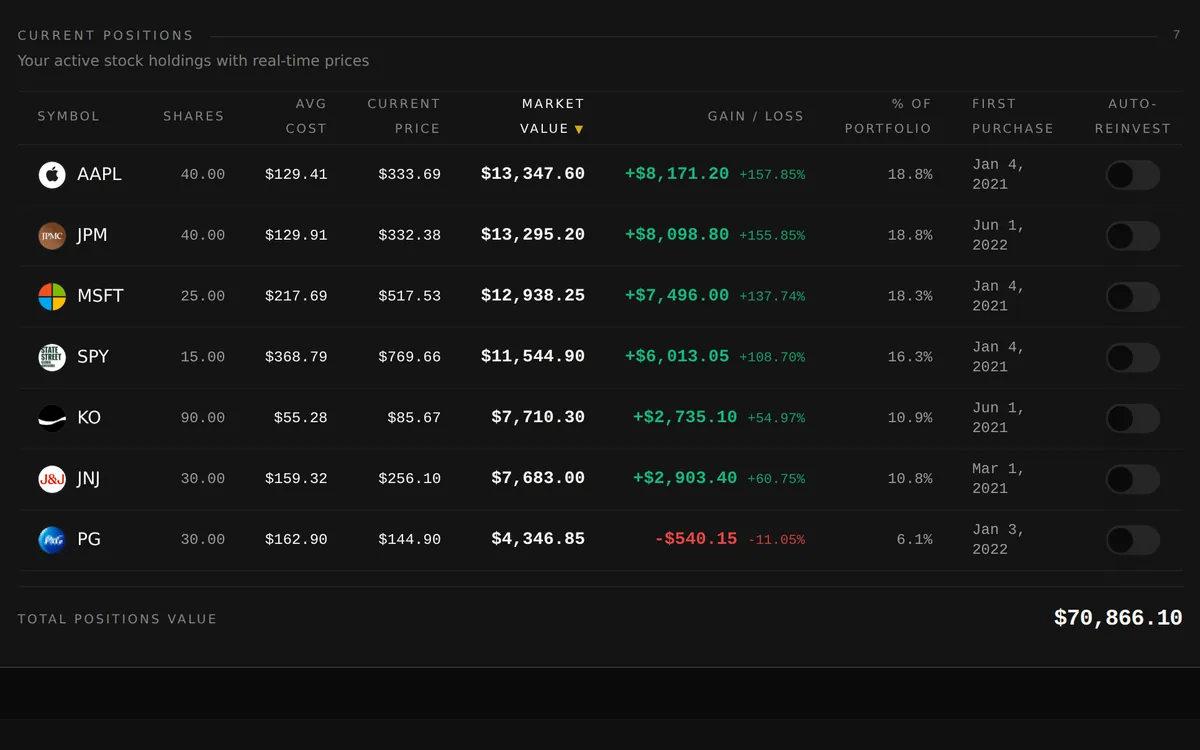
Every position with shares, cost, price, market value, gain and weight in one table.
The holdings table places shares, average cost, current price, market value, gain or loss, and portfolio weight on the same row, with first-purchase dates for context. In a portfolio you enter, the Auto-Reinvest switch on each row sets whether that holding's dividends buy more shares or go to cash.
- Sort positions to find the largest holdings
- Compare current value with recorded cost
Capabilities
Replace your dividend tracker spreadsheet
Download the CSV template, copy your trades and cash movements from Excel or Google Sheets into its columns (date, type, symbol, shares, price, amount, fee, notes), and import the file. Each row is checked before import. Dividends, income totals, and returns are then worked out for you, so there is no sheet to update after every payment.
Dividend calendar and income
See each upcoming ex-dividend date and pay date for the next 90 days with your share count and the estimated cash, marked declared or projected. Above it sit forward 12-month income, yield on cost, lifetime dividends received, and income growth from the year before.
Dividend reinvestment settings
Turn auto-reinvest on or off for each holding in a portfolio you enter. Reinvested dividends are recorded as new shares, and dividends you do not reinvest are added to cash, so share counts match how you handle income. These settings change your GNG records only and never place brokerage orders.
Dividend coverage and growth
For the stocks you own, review five-year dividend growth weighted by income, payout ratio, and dividends as a share of free cash flow, plus each holding's growth streak, payment frequency, and last payment. Income by sector shows how much of your dividend income depends on one part of the market.
Transaction history
Add or edit transactions in a portfolio you enter, import a CSV, and filter the ledger by date, ticker, type, or amount. Review realized gains separately from open-position gains, and download an individual portfolio as an Excel workbook.
Brokerage connections
With Pro Lite or higher, connect supported brokerage accounts and choose which accounts to import. Review connection status, refresh a linked account, or manage its connection. Linking is read-only: GNG cannot place trades or move your assets.
ETF look-through
Find ETF overlap by expanding funds into their underlying stocks, including direct and indirect exposure to the same company. Compare stated and look-through sector weights, inspect overlapping holdings, and review fund details and expense ratios where available.
Research your holdings
Review the valuation, profitability, growth, and balance sheet profile of the companies you hold, with coverage shown for each measure. Open portfolio tickers in the Research Terminal, or discuss holdings with GNG Analyst; its Accounts control and your Privacy settings decide what it can read, and chats use GNG credits.
Hedging, reports, and model portfolios
On Pro Lite and higher, examine an individual portfolio's market exposure, compare candidate hedge ETFs, and inspect sizing, multi-ETF combinations, and historical stress tests. Pro Lite and higher also include portfolio research reports, subject to plan limits, and GNG Pro adds scheduled reports and model portfolios from the analyst desk.
How it works
Add your portfolio
Create a free GNG account, name a portfolio, and enter trades by hand or import them from a CSV file. Pro Lite members can link supported brokerage accounts instead.
Track dividends automatically
GNG adds the dividends your holdings paid and projects the income ahead. Switch on auto-reinvest for any holding you reinvest, then check the dividend calendar for upcoming ex-dividend and pay dates.
Review and compare
Compare returns with a benchmark, check realized gains and sector weights, combine selected portfolios, or send your holdings to the Research Terminal and GNG Analyst for more research.
Common questions
- Is this dividend tracker free?
- Yes. Tracking dividends in portfolios you enter by hand or import from a CSV file is free with a free GNG account, including the Dividends tab and calendar. Paid plans raise the portfolio limit and add brokerage linking.
- How do I keep track of my dividend payments?
- Record your buys and sells by hand or from a CSV file. GNG adds the last five years of dividends from each holding's payment history and the shares you held on each ex-dividend date, then shows income by month and upcoming pay dates.
- Can I import my dividend tracker spreadsheet?
- Yes. Copy your Excel or Google Sheets trades, plus any cash deposits and withdrawals, into the CSV template and import it into a portfolio you own. Leave out dividend rows: GNG adds dividends from each holding's dividend history after the import.
- Does it track dividends automatically?
- Yes. Once your trades are in, GNG adds the dividends for you, so you only record buys, sells, and cash moves. To bring in holdings and transactions from your broker instead, Pro Lite and higher plans add read-only brokerage linking; GNG never places trades.
- Does the tracker include dividend reinvestment?
- Yes, for portfolios you enter. Turn auto-reinvest on or off for each holding: reinvested dividends are recorded as new shares, and the others are added to cash. These settings update your GNG records only; they never place brokerage orders.
- Are model portfolios included?
- Model portfolios from the GNG analyst desk are included with GNG Pro and higher plans.
Create a free account and start tracking your dividend income.
Free to join. No credit card. Takes seconds.
Portfolio analytics are for information only and are not a recommendation to buy or sell any security. Projected dividends are estimates and can change.