Portfolio Backtester
Backtest a dividend stock or ETF portfolio
Backtest a portfolio of stocks and ETFs with each holding's dividend history, reinvested or paid as cash, and see the returns, drawdowns and yearly income.
Free with a free GNG account. Paid plans raise the limits.
You must be logged in to view this page. Log in or create a free account.
Free to join. No credit card. Takes seconds.
Overview
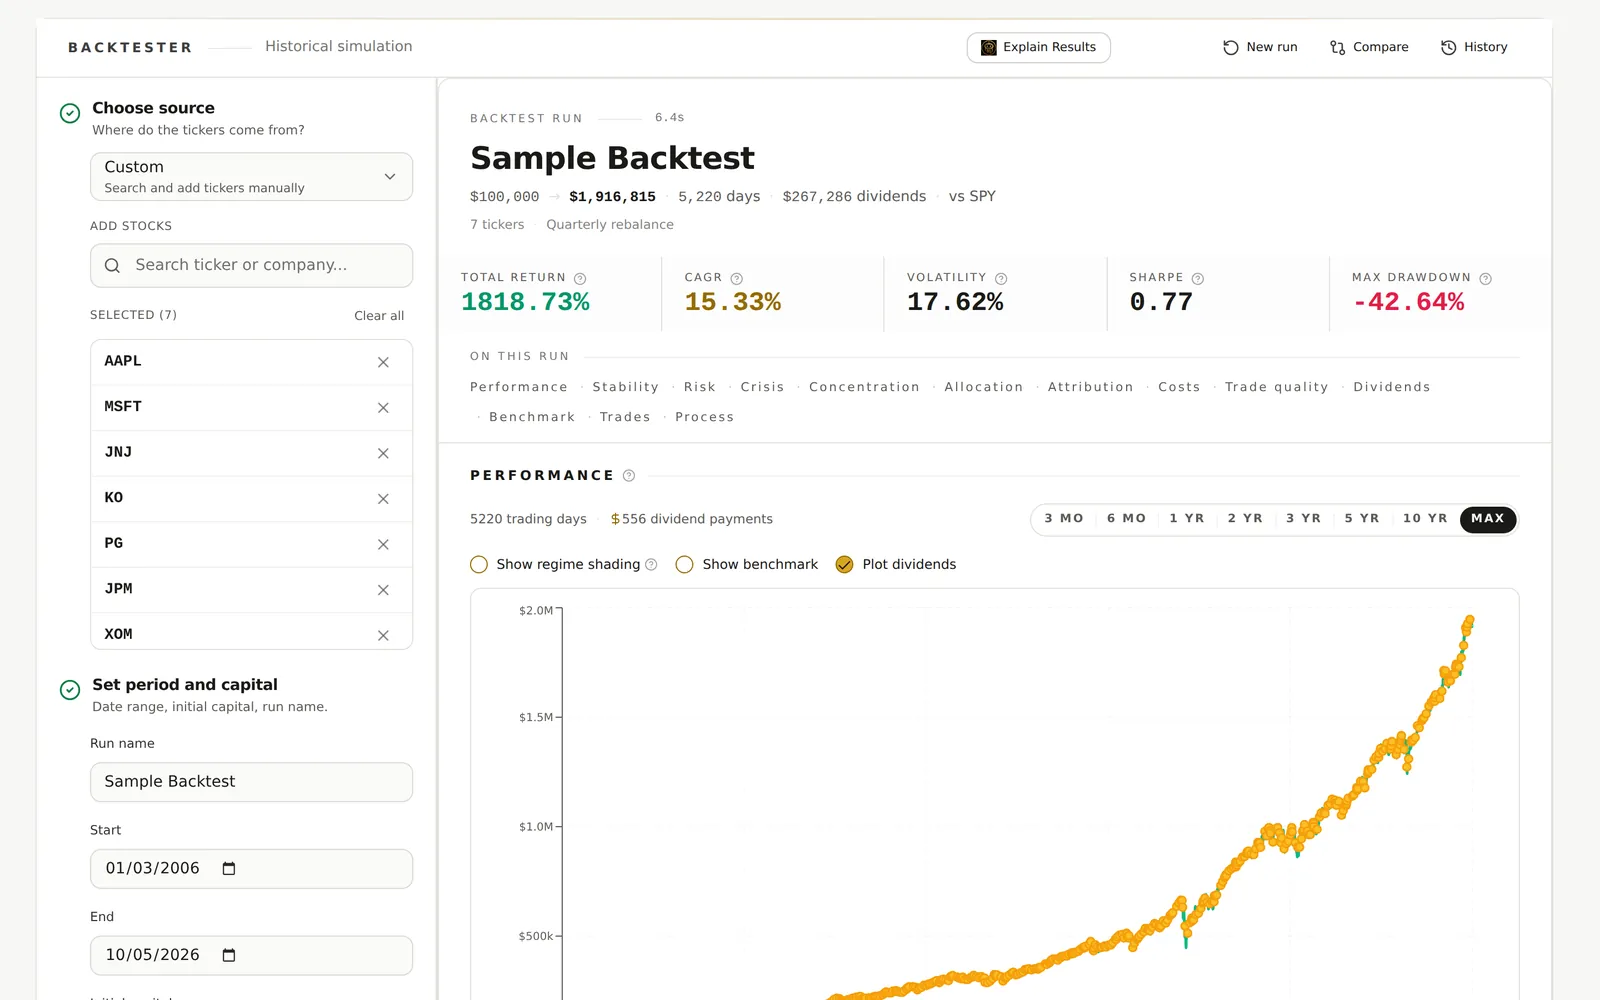
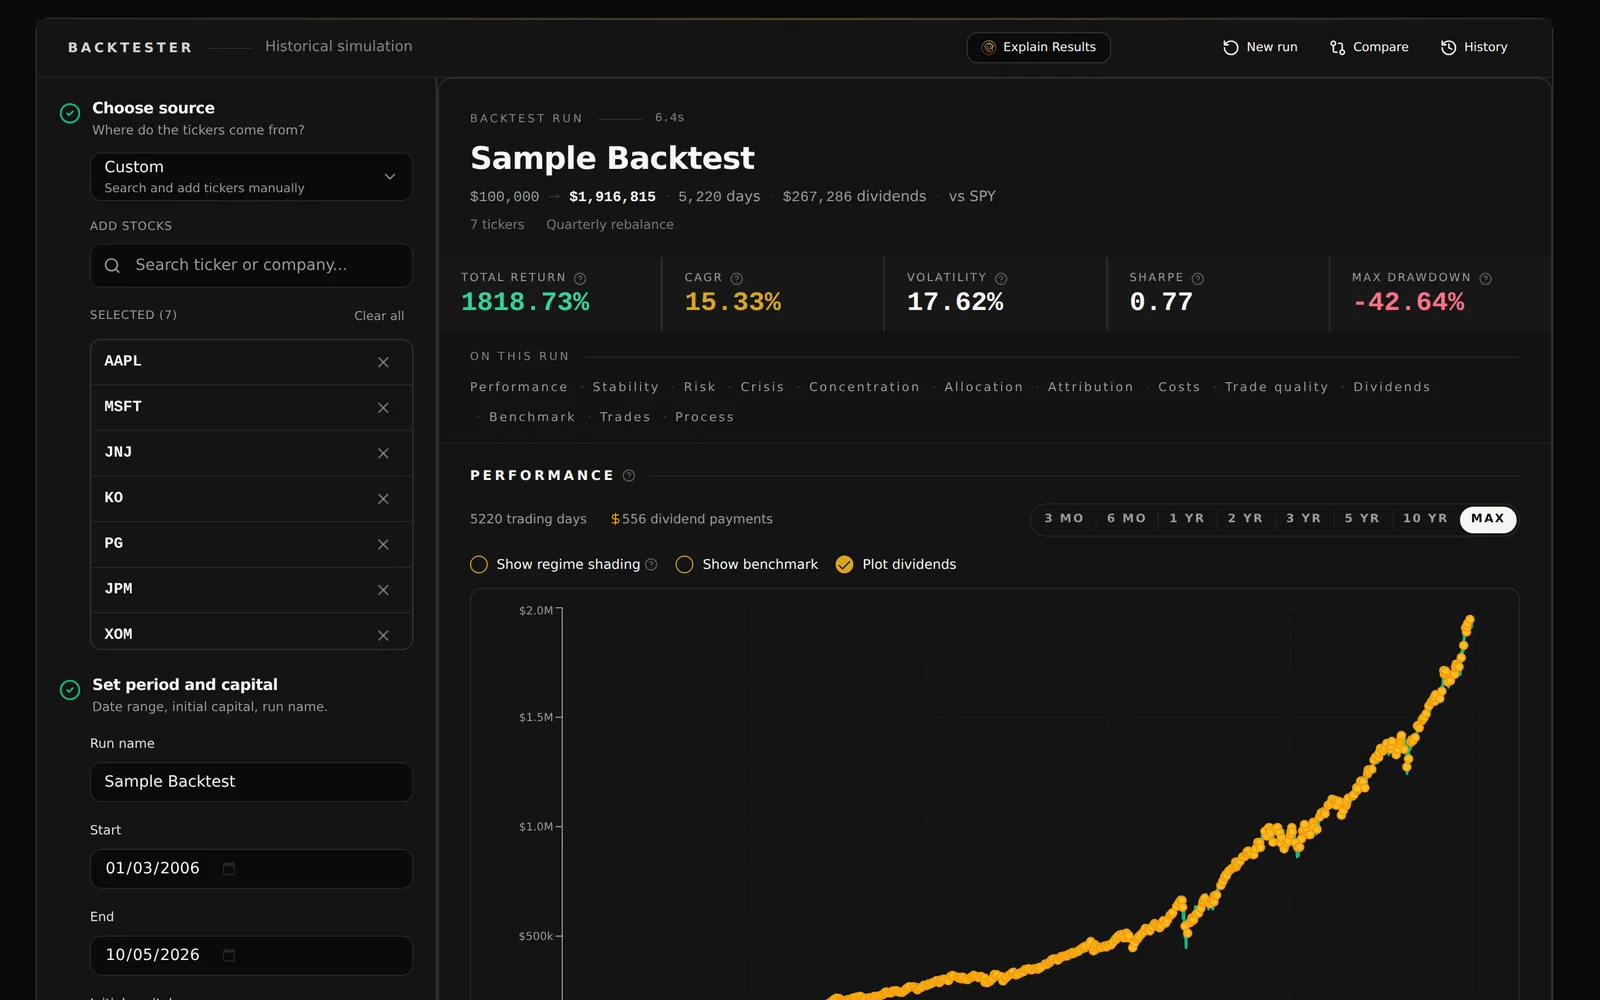
Portfolio backtesting is a historical portfolio simulation: it replays a set of holdings over past market data to show how the portfolio would have done. A dividend portfolio backtest adds the income side, meaning what the holdings paid each year and what reinvesting it added. The GNG Portfolio Backtester runs on daily prices and each holding's dividend history, free with a GNG account, with start dates as early as 1999 where price history allows. Choose holdings, weights, starting capital, dates, and a benchmark, then decide whether dividends are reinvested or paid out as cash.
With Reinvest dividends on, each payment buys more shares of the same holding at that day's closing price on the ex-dividend date. With it off, dividends collect as cash, net of a dividend tax rate you set. Either way, the returns include the dividends. The Dividends section shows total dividends, average annual income, yield on cost, three-year dividend growth, each year's income with its change from the year before, and the share of the total return that came from dividends.
Backtesting a portfolio before you change your holdings shows how an asset allocation or a dividend strategy held up through past markets. Save a run, switch dividend reinvestment or the rebalancing schedule, and compare the runs side by side. Each backtest starts from one amount of starting capital, with no added contributions or withdrawals. To look ahead, use Monte Carlo Forecasting, or the Dividend Forecaster on Pro Lite and higher plans.
What you get
- Dividends reinvested or paid out as cash, with a tax rate
- Dividend income by year, yield on cost, and dividend growth
- Portfolio backtests for stocks and ETFs on daily prices
- Asset allocation backtests with scheduled rebalancing
- CAGR, Sharpe, max drawdown, recovery, and any benchmark
- Saved runs to compare DRIP on and off side by side
Inside the tool
Crisis scorecard
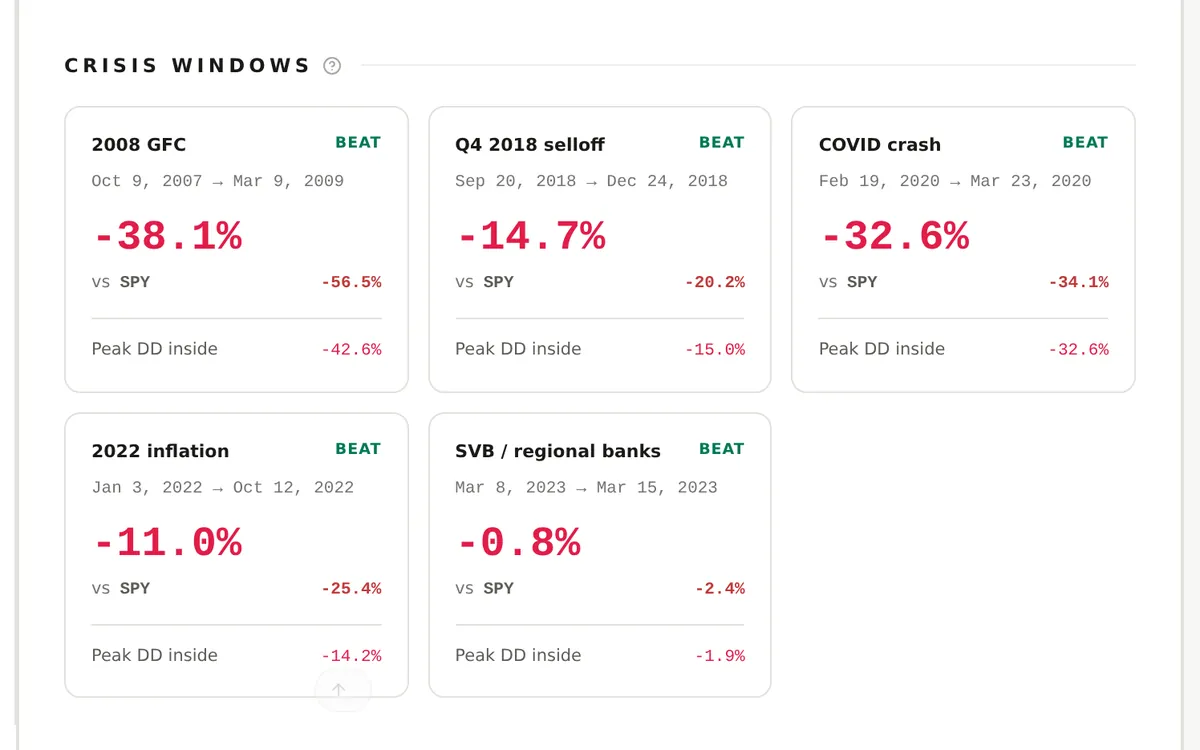
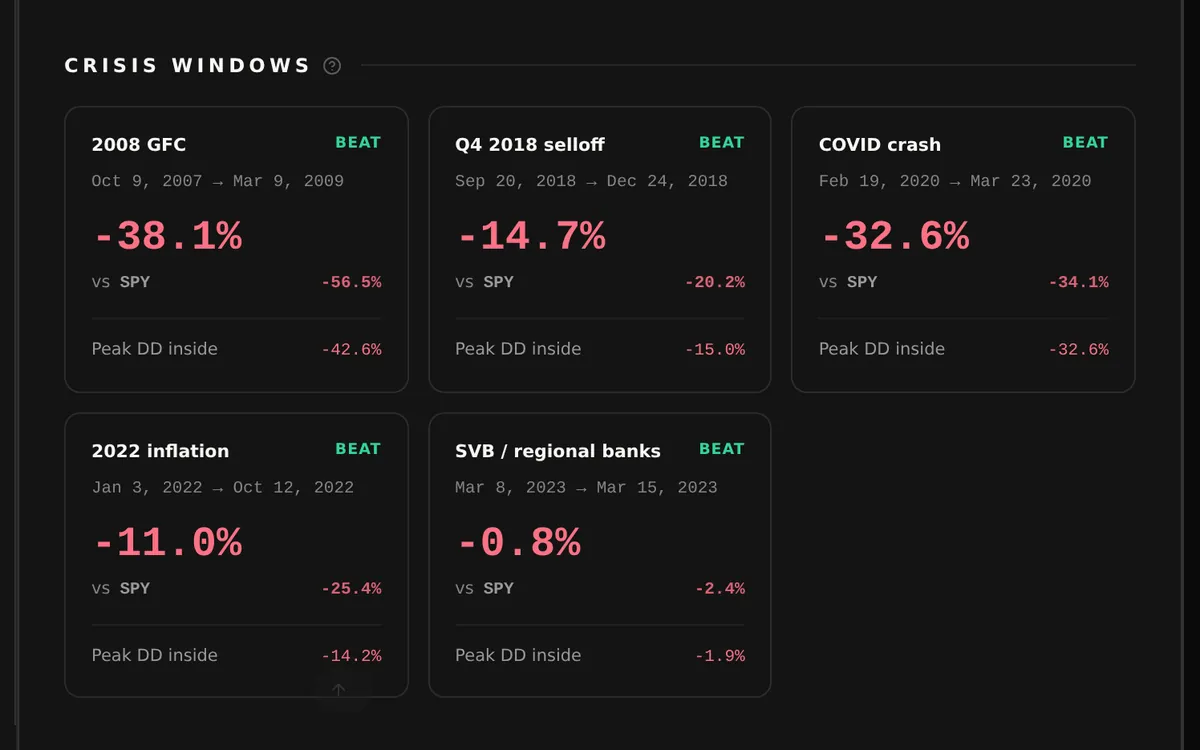
See how the portfolio held up against the benchmark in 2008, 2018, 2020, 2022 and 2023.
The crisis scorecard shows how the portfolio and its benchmark did in named periods of market stress inside your dates, from the dot-com bust and the 2008 financial crisis to the COVID crash, the 2022 inflation selloff, and the 2023 regional bank stress. Each card adds the portfolio's deepest drawdown in that window, so you can see whether a dividend portfolio held up when prices fell.
- Portfolio and benchmark returns for each covered crisis
- Peak drawdown inside the same dates
- Only crisis windows that fall fully inside the run are shown
Monthly returns
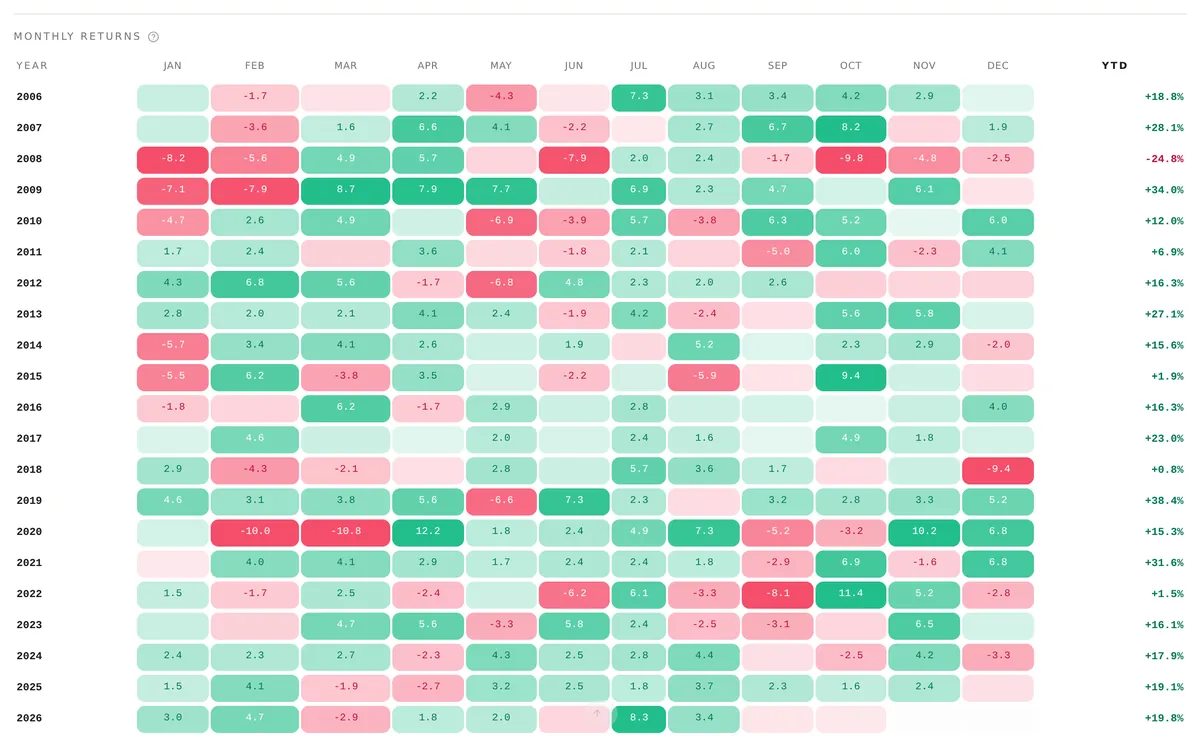
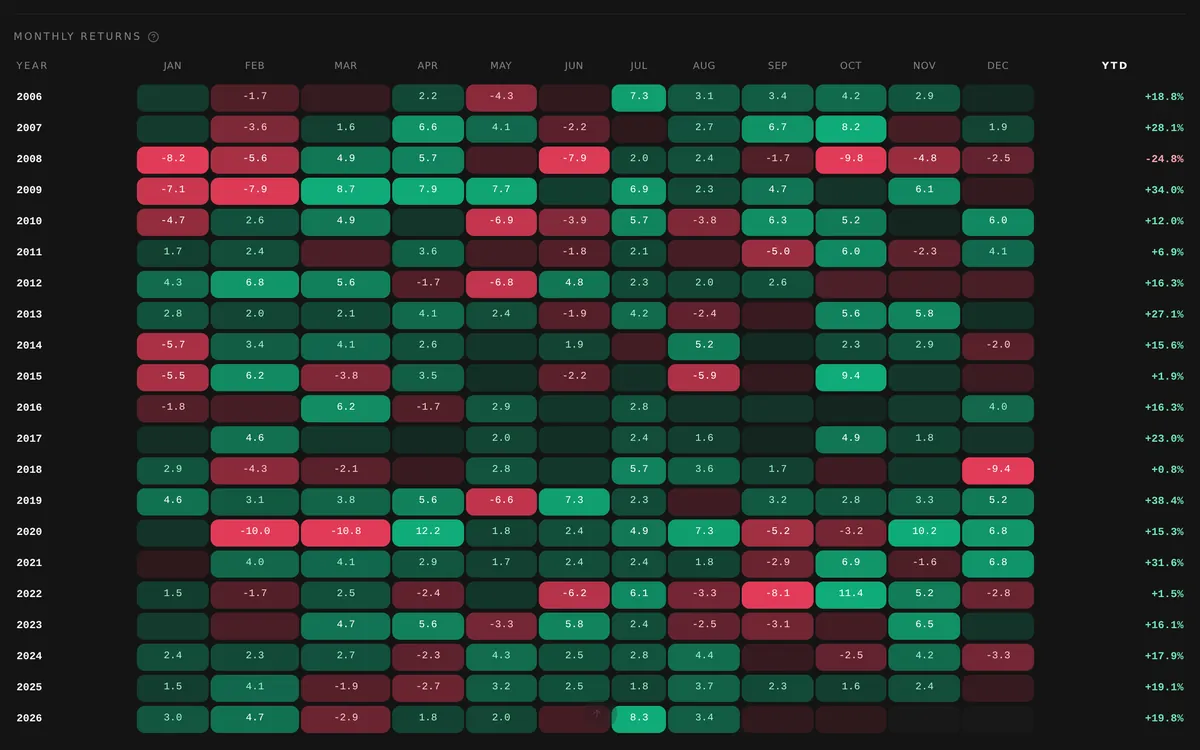
Every month of the backtest in one heatmap, with the full-year return beside each row.
The monthly returns heatmap puts the backtest into a calendar. Green and red cells mark gains and losses, and the year-to-date column compounds the months in each year. Returns include dividends, whether reinvested or held as cash. Scan across a row for a difficult stretch, or down a column to compare the same month in different markets.
- Month-by-month returns alongside each calendar year
- Color intensity makes larger moves easier to locate
- Annual totals show how monthly gains and losses compound
Capabilities
Choose your holdings
Backtest a custom basket of stocks and ETFs, or load holdings from an available personal or model portfolio. Combine portfolios when you want to test them together, then use equal weights or edit the allocation for each ticker.
- Name each run and set its starting capital
- Select start and end dates within available price history
Reinvest or collect dividends
Turn on Reinvest dividends to buy more shares of the same holding at the closing price on each ex-dividend date. Turn it off to hold the payments as cash and apply a dividend tax rate. Run the same portfolio both ways to see what reinvesting added.
- Uses each holding's dividend history, not an assumed yield
- Reinvested dividends buy fractional shares, never rounded down
Track dividend income
The Dividends section shows total dividends, average annual income, yield on cost, and three-year dividend growth. A chart and an annual table show each year's income and its change from the year before, so you can see whether the income kept growing.
- Dividend share of total return versus price gains
- Dividend markers on the portfolio growth chart
Set trading rules
Keep a static allocation, or hold only the top names from your list by a valuation metric such as the lowest P/E, P/B, PEGY, or cash-adjusted PEGY, equally weighted. Pick how often to rebalance to see how an asset allocation or a rotation rule would have changed over time.
- Buy and hold, or rebalance monthly, quarterly, semiannually, or annually
- Rebalancing trades on the first trading day of each new period
Include trading costs
Set commission and slippage before running the test. The results separate commissions, slippage, total friction, and annual turnover, so you can see what the strategy cost to keep up.
- Inspect how frequent trading affects the result
Compare with a benchmark
Read total return, CAGR, volatility, and Sharpe beside the portfolio growth chart. Add a benchmark ticker such as SPY to compare annual returns, alpha, beta, correlation, tracking error, and performance in rising and falling markets.
- Toggle the benchmark overlay, dividend markers, and market-regime shading
- Track rolling Sharpe, volatility, and beta across different windows
Examine downside risk
Look beyond the final value with drawdown charts, recovery periods, time underwater, and the largest declines. Sortino, Calmar, the Ulcer Index, and tail-loss estimates describe different aspects of the historical risk.
- Review daily return distributions and the best and worst days
- Compare value at risk with losses beyond that threshold
Trace holdings and trades
Find the holdings that added or cost the most, and see how allocations changed during the run. The transaction record lists every buy, sell, dividend, reinvestment, and split, and you can filter it by trade type, year, or reason.
- Allocation history and holding-level contribution tables
- Rebalance details from prior weights to target weights
- Trade-quality analysis of decisions that helped or hurt
Revisit and compare runs
Search saved backtests, rename or remove a run, or run its setup again. Compare completed runs on one growth chart with return and risk metrics side by side, such as the same portfolio with dividends reinvested and paid out. The GNG Analyst action can carry your setup or results into a conversation, subject to AI access and credits.
- Results use a stacked reading layout on phones
- Compare strategy changes without rebuilding each setup
How it works
Add your holdings
Add the stock or ETF tickers you want to backtest, or load an available portfolio. Use equal weights or enter your own allocation for each holding.
Set the dividend rules
Choose dates, starting capital, a benchmark, and a rebalancing schedule. Turn Reinvest dividends on or off, and add trading costs or a tax rate for cash dividends.
Read the results
Review the growth chart against your benchmark, the income for each year, the drawdowns, and the holdings that drove the result. Use the transaction record to see every trade.
Compare the alternatives
Save the run, change one assumption such as dividend reinvestment, and run it again. Compare the runs to see how the change moved returns and risk.
Common questions
- Is the Portfolio Backtester free?
- Yes. The Portfolio Backtester is free with a free GNG account, with the same date range and reports as paid plans. Paid plans raise the run and ticker allowances. Your account shows the limits that currently apply.
- How do you backtest a dividend portfolio?
- Add your dividend stocks and ETFs, then set weights, dates, starting capital, and a benchmark, and choose whether to reinvest dividends. Run the test, read the growth chart, yearly income, and drawdowns, and save the run to compare changes.
- Can I backtest a portfolio with dividends reinvested?
- Yes. Reinvest dividends is on by default: each dividend buys more shares of the same holding at that day's close on the ex-dividend date. Turn it off to hold dividends as cash, net of a dividend tax rate you can set.
- What dividend results does the backtest show?
- Total dividends, average annual income, yield on cost, three-year dividend growth, and each year's income with its change from the year before. It also shows the share of the total return that came from dividends versus price gains.
- Can I backtest an asset allocation with rebalancing?
- Yes. Use equal or custom weights, then hold them or rebalance monthly, quarterly, semiannually, or annually. Each rebalance trades on the first trading day of the new period, and the commission and slippage settings show what it cost.
- How far back can a portfolio backtest go?
- The date picker supports backtests starting in 1999. Usable history depends on the selected securities and their available daily prices. Review any data availability warnings in the result.
Create a free account and backtest your dividend portfolio.
Free to join. No credit card. Takes seconds.
Backtests are hypothetical and for education. Past performance does not guarantee future results, and nothing here is a recommendation to buy or sell any security.