Monte Carlo Forecasting
Monte Carlo simulation for your portfolio
A free Monte Carlo simulator for stocks and ETFs. Run thousands of possible paths, from one week to 10 years, and see a range instead of one guess.
Free with a free GNG account. Paid plans raise the limits.
You must be logged in to view this page. Log in or create a free account.
Free to join. No credit card. Takes seconds.
Overview
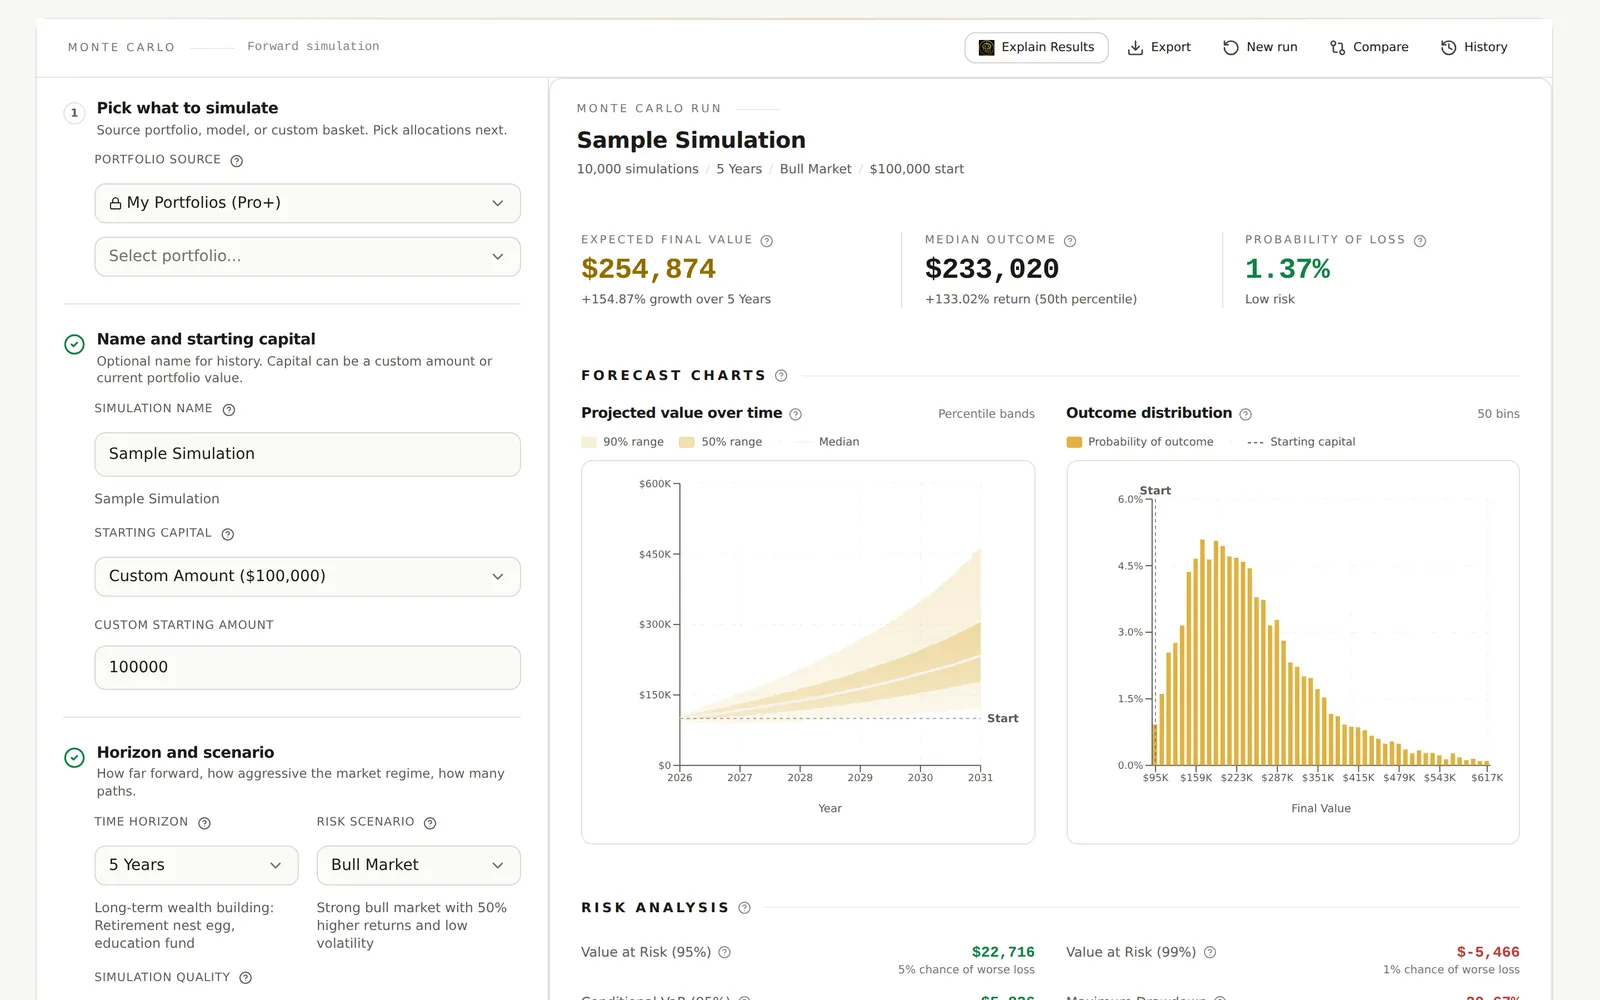
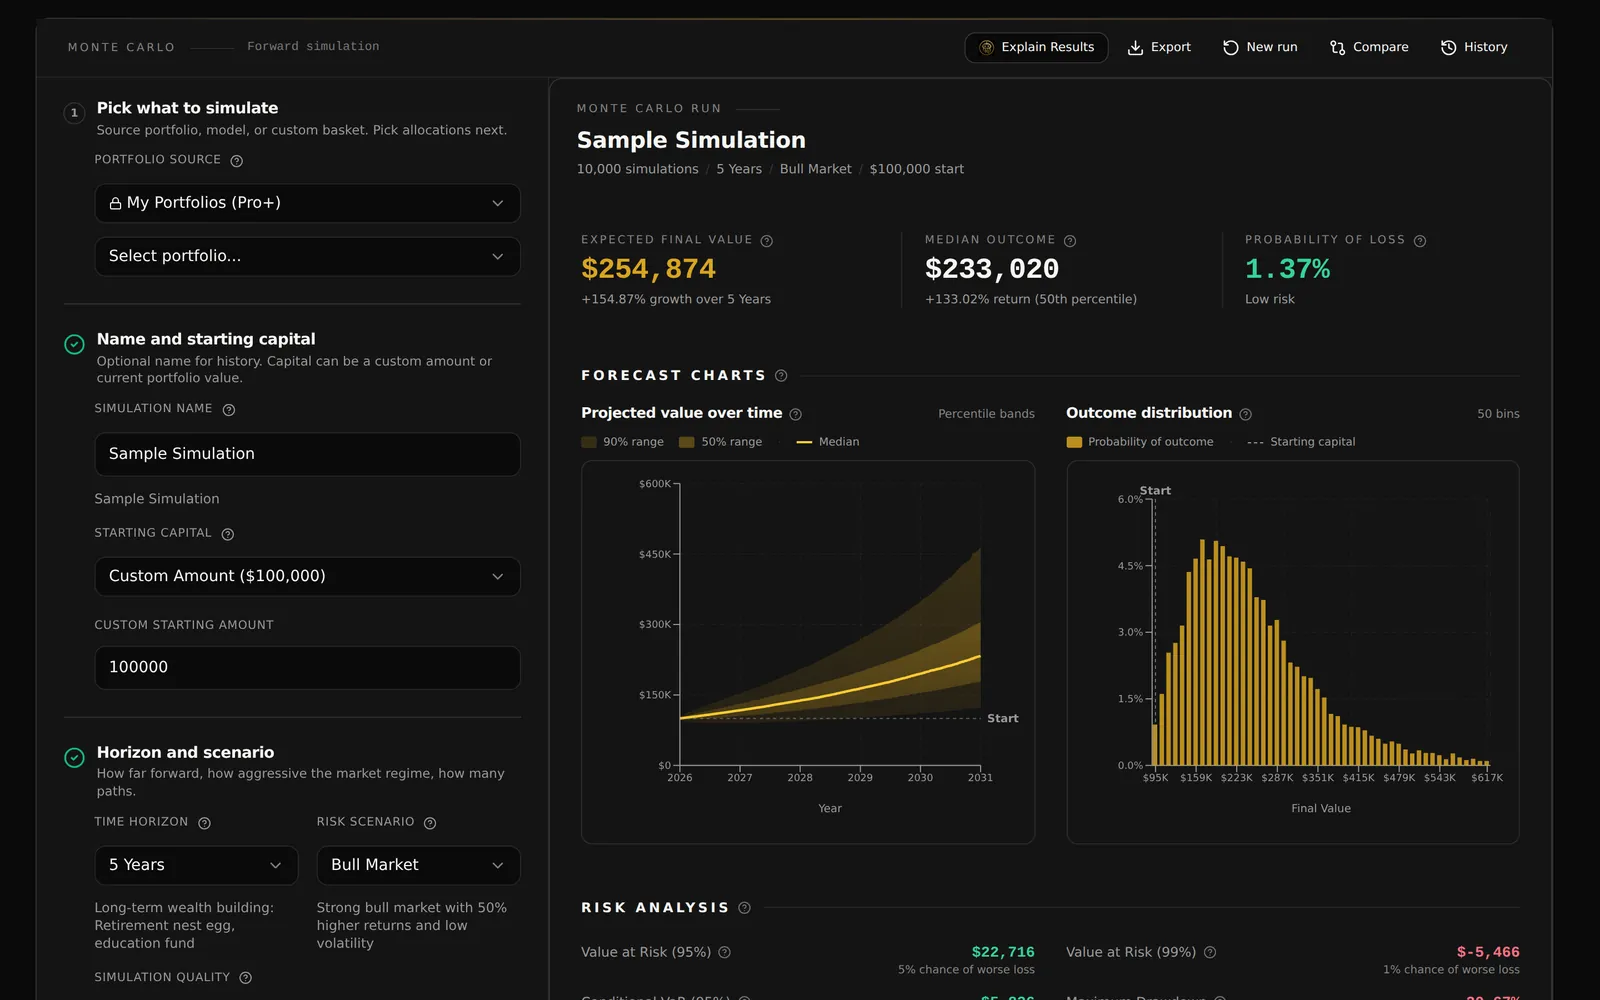
A Monte Carlo simulation for a portfolio runs thousands of possible futures to show the range of values your holdings could reach, rather than a single forecast. Monte Carlo Forecasting does this online for one stock or a full portfolio of stocks and ETFs. Each path uses random daily returns that follow the historical average return, volatility, and correlations of your holdings, adjusted by the market scenario you pick. The results show the median outcome, the spread around it, and the chance of finishing below your starting amount.
Use the simulation to check an investment plan before you act on it. Set the weights, a starting amount, and a horizon from one week to 10 years. Then test what matters to you: regular contributions or withdrawals, rebalancing and trading costs, a stress case such as a 2008-style crisis, or a target value. Every run is saved, so you can change one assumption and compare the results side by side.
The results describe your assumptions, not a promise of what markets will do. Past return patterns can change, and actual outcomes can fall outside the simulated range. To see how the same holdings performed in the past, test them in the free Portfolio Backtester, then follow the ones you keep in the Portfolio Tracker.
What you get
- Simulate one stock or a full stock and ETF portfolio
- Median, average, and 5th to 95th percentile outcomes
- Chance of a loss and odds of reaching a target
- Contributions and withdrawals with inflation
- Normal or fat-tailed returns and market scenarios
- Saved runs, side-by-side comparisons, Excel export
Inside the tool
Range of outcomes
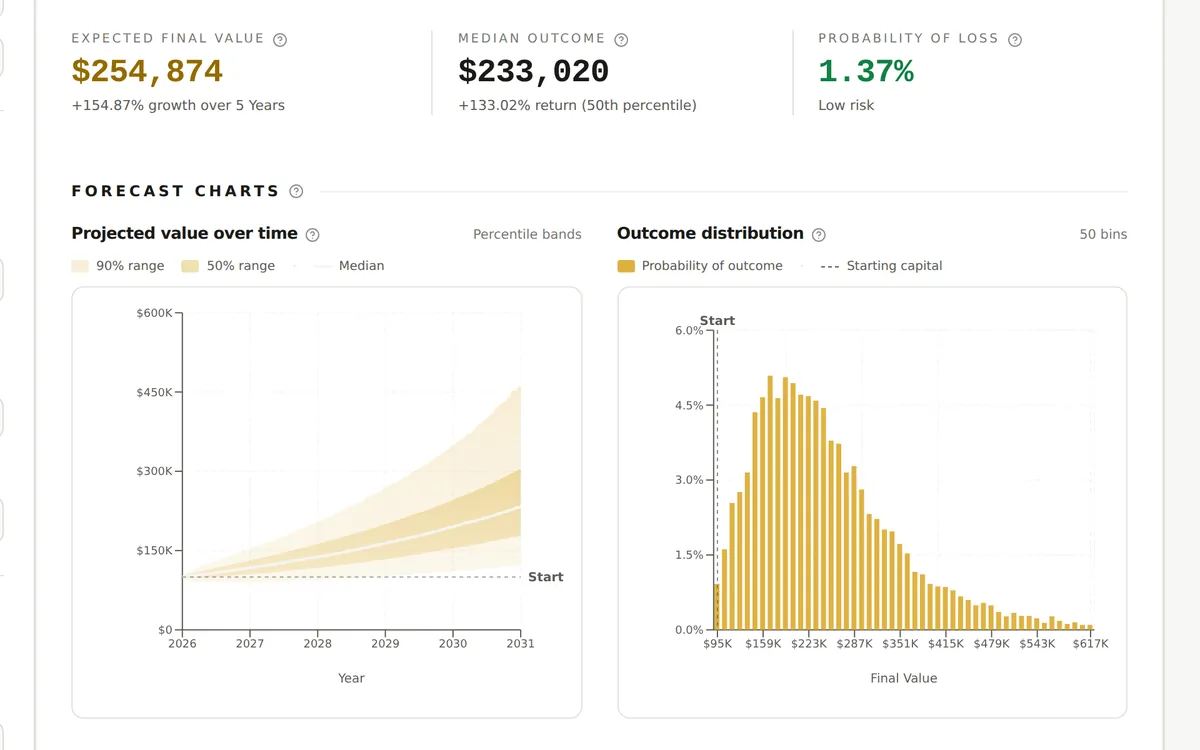
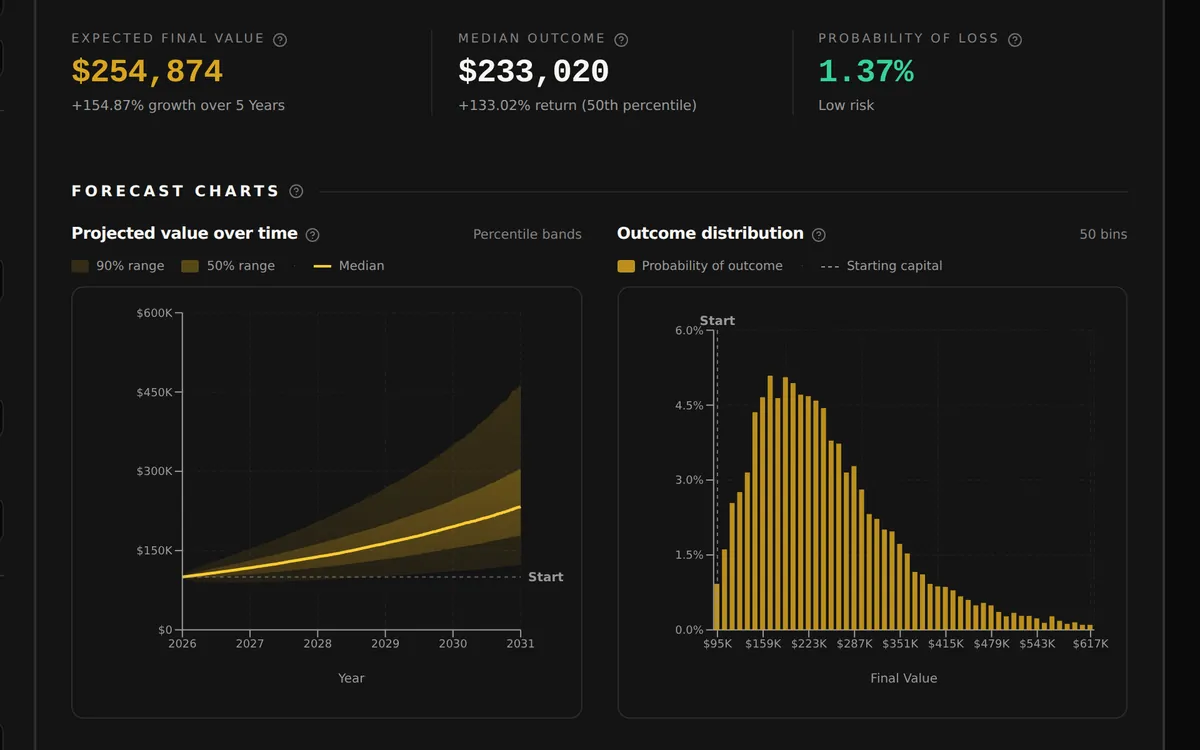
Thousands of simulated paths show the expected value, the median outcome and the chance of a loss.
The fan chart shades the middle 50% of simulated paths (25th to 75th percentile) and the middle 90% (5th to 95th), with the median running through the center. The histogram shows how often each ending value occurred, with your starting capital marked. The average often sits above the median because a few strong paths pull it up, so the page shows both.
- Median line with 50% and 90% outcome bands
- Ending-value histogram with a starting-capital line
- Average and median results shown separately
Inputs and risk
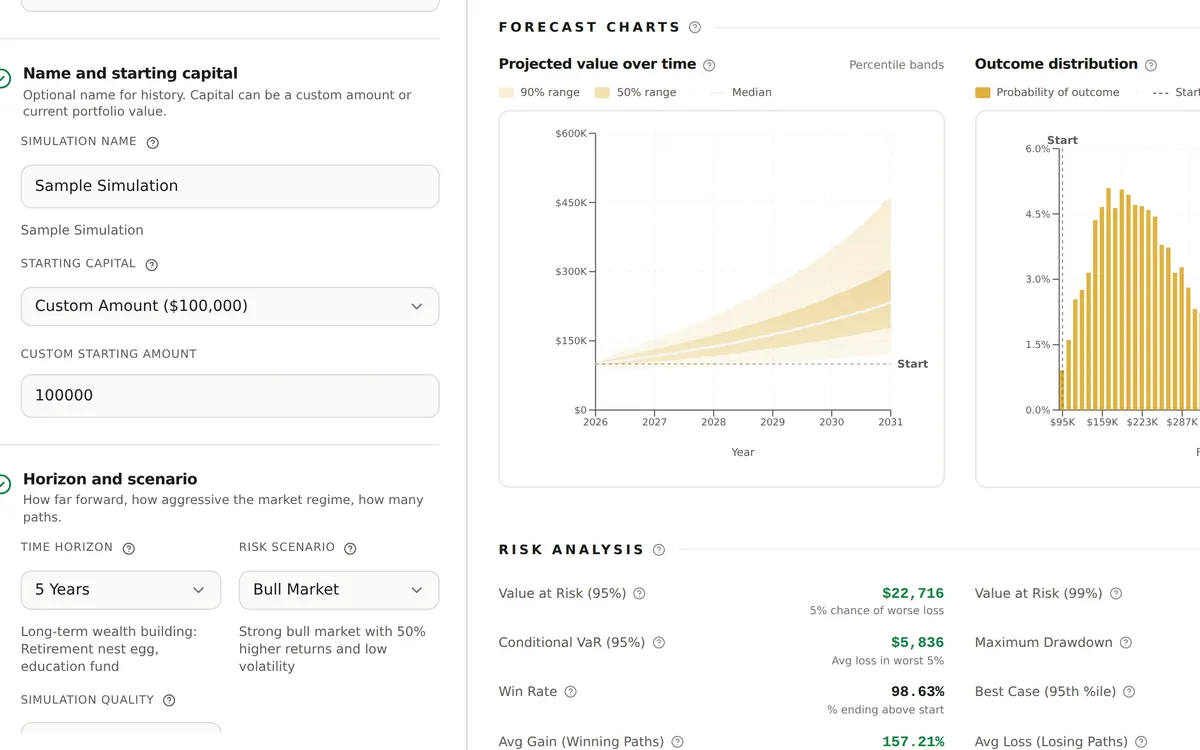
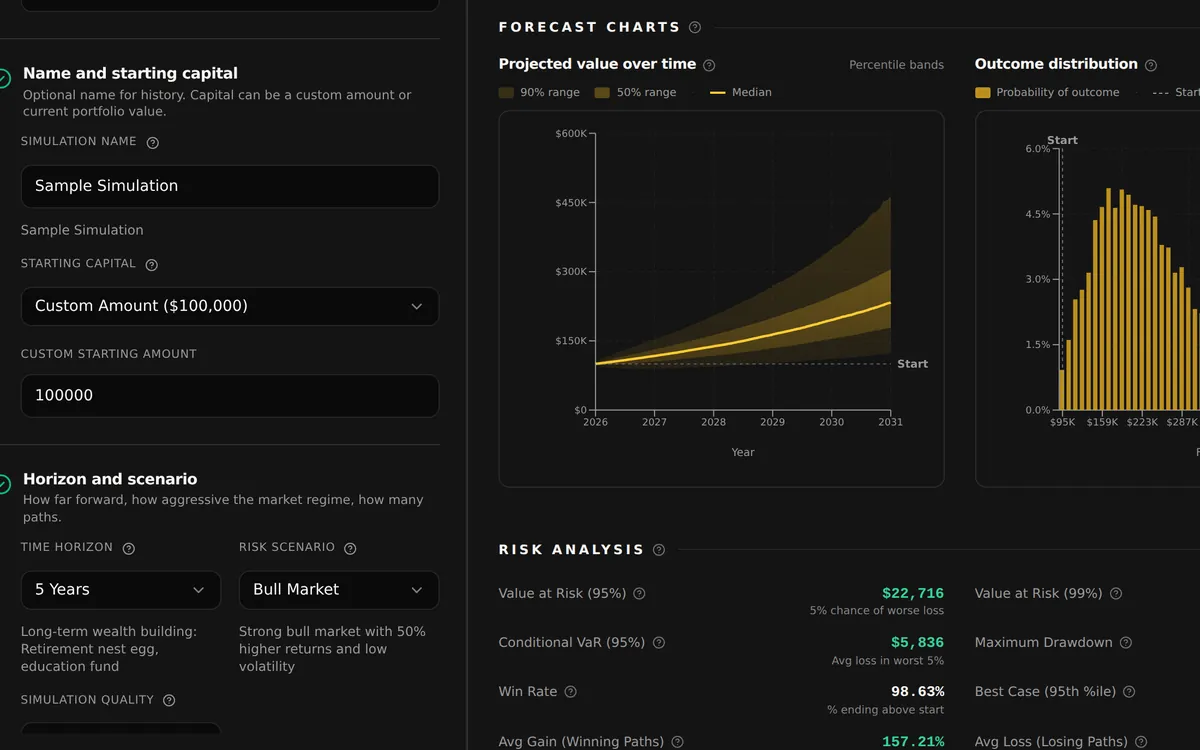
Set the starting amount, horizon and scenario, then read the risk analysis beside the forecast.
The simulator inputs record the starting capital, time horizon, market scenario, and simulation detail. Below the forecast, the risk analysis lists value at risk at 95% and 99%, conditional value at risk, maximum drawdown, and win rate, so you can judge how deep the bad paths go as well as how often they happen.
- Name each run so it is easy to find later
- Choose the horizon, market scenario, and simulation detail
- Read downside measures next to the growth range
Capabilities
Build an allocation
Free accounts can simulate one stock or a custom basket of stock and ETF tickers with equal or custom weights. GNG Pro and higher plans can also start from a personal or model portfolio, with starting capital based on a chosen amount or the portfolio value.
- Adjust individual weights before running a simulation
- Run and ticker allowances depend on the account plan
Choose return assumptions
Pick how many years of daily price history shape the inputs, then choose Normal or Student-t returns. Student-t allows more extreme days. Market scenarios scale expected return and volatility, and cash-like holdings use the 3-month Treasury rate as their expected return.
- Five scenarios, from a 2008-style crisis to a bull market
- Forecast horizons from one week to 10 years
- Review data-adjustment notices and the history used for each holding
- Choose simulation detail to balance speed and precision
Model cash flows
Add recurring contributions or withdrawals as a dollar amount or a share of the portfolio. Choose a payment frequency. For dollar cash flows, optionally increase the amount with inflation to test a savings or withdrawal plan.
- Monthly, quarterly, semiannual, or annual cash flows
- View total contributions and returns net of contributions
Account for costs
Choose buy and hold or periodic rebalancing and enter commission and slippage assumptions. The cash-flow and cost section reports transaction costs and their effect on the simulation.
- Compare the cost of maintaining different allocations
- Separate investment results from money added to the account
Test a target
Enter a target portfolio value to see the estimated probability of reaching it. The result includes the median shortfall among paths that miss the target and median excess among those that exceed it.
- Evaluate a goal under different saving assumptions
- Compare target results across saved scenarios
Examine diversification
The correlation heatmap shows how closely holdings have moved together. Read pairwise relationships, average correlation, hedge pairs, and the most independent or clustered holdings to understand what diversification the basket provides.
- Portfolio diversification summary and effective holdings
- Correlation with the market benchmark where available
Inspect each holding
The holdings table links weights to the historical growth rate, the rate used in the simulation, volatility, and available price history. It also shows each holding's weighted growth contribution so you can inspect what drives the assumptions.
- Separate historical inputs from scenario-adjusted inputs
- Check shorter histories before comparing results
Compare risk measures
Review Sharpe, Sortino, and Calmar alongside gain and loss probabilities. Distribution details include percentile values, skewness, kurtosis, extreme returns, peak gains, and drawdowns to describe more than the middle outcome.
- Risk-free rate and its observation date in the run summary
- Average gains on winning paths and losses on losing paths
Save and compare
Reopen, rename, rerun, or remove saved simulations. Compare their settings, metrics, percentile tables, and overlaid forecast charts, then export runs or comparisons to Excel. GNG Analyst can review setup or results, subject to AI access and credits.
- Inputs and result charts stack vertically on phones
- Export a simulation without running it again
How it works
Choose stocks or a portfolio
Add one stock or several stocks and ETFs and set equal or custom weights. On GNG Pro and higher plans, you can start from a personal or model portfolio instead.
Set your assumptions
Choose starting capital, horizon, scenario, and return distribution. Add contributions, withdrawals, costs, or a target value if needed.
Read the range
Start with the median and the 5th to 95th percentile band, then check the chance of a loss, the downside measures, and the holdings behind the simulation.
Compare saved runs
Change an assumption and run another scenario. Compare completed simulations or export the results to Excel for further review.
Common questions
- What is a Monte Carlo simulation for a portfolio?
- It is a way to test many possible futures at once. The simulation runs thousands of paths for your holdings, using random daily returns shaped by their past returns, volatility, and correlations, then shows the range of ending values and how often each happened.
- Can I run a free Monte Carlo simulation online?
- Yes. Create a free GNG account and run Monte Carlo simulations on custom stock and ETF baskets in your browser. Paid plans raise the limits, and GNG Pro and higher plans add personal and model portfolios as sources.
- Can I run a Monte Carlo simulation on a single stock?
- Yes. Add one stock or ETF at a 100% weight, or build a basket of several. Either way you get the range of outcomes, the median, the chance of a loss, and the downside measures for that holding or mix.
- How do I read Monte Carlo simulation results?
- Start with the median, the middle outcome. The 5th and 95th percentiles mark the edges of the middle 90% of paths, and the 25th and 75th mark the middle 50%. The probability of loss is the share of paths that ended below your starting amount.
- Can I model contributions, withdrawals, or a target value?
- Yes. Add recurring deposits or withdrawals as a dollar amount or a share of the portfolio, monthly to annually, and grow dollar amounts with inflation. Enter a target value to see the chance of reaching it and the median shortfall or excess.
- How accurate is a Monte Carlo simulation?
- It is an estimate, not a prediction. Each run uses daily price history, about 18 years by default, over a horizon from one week to 10 years, and actual results can fall outside the simulated range when markets change.
Create a free account and run your first Monte Carlo portfolio simulation.
Free to join. No credit card. Takes seconds.
Monte Carlo results are probability estimates for education and planning. They are not predictions or investment advice.