Options Screener
Options scanner with Greeks and IV rank
Find the option contracts that fit your rules. Scan stock and ETF options by Greeks, IV rank, IV percentile, volume, and open interest, then compare them.
Included with GNG Pro and higher plans. Start with a free GNG account.
You must be logged in to view this page. Log in or create a free account.
Free to join. No credit card. Takes seconds.
Overview
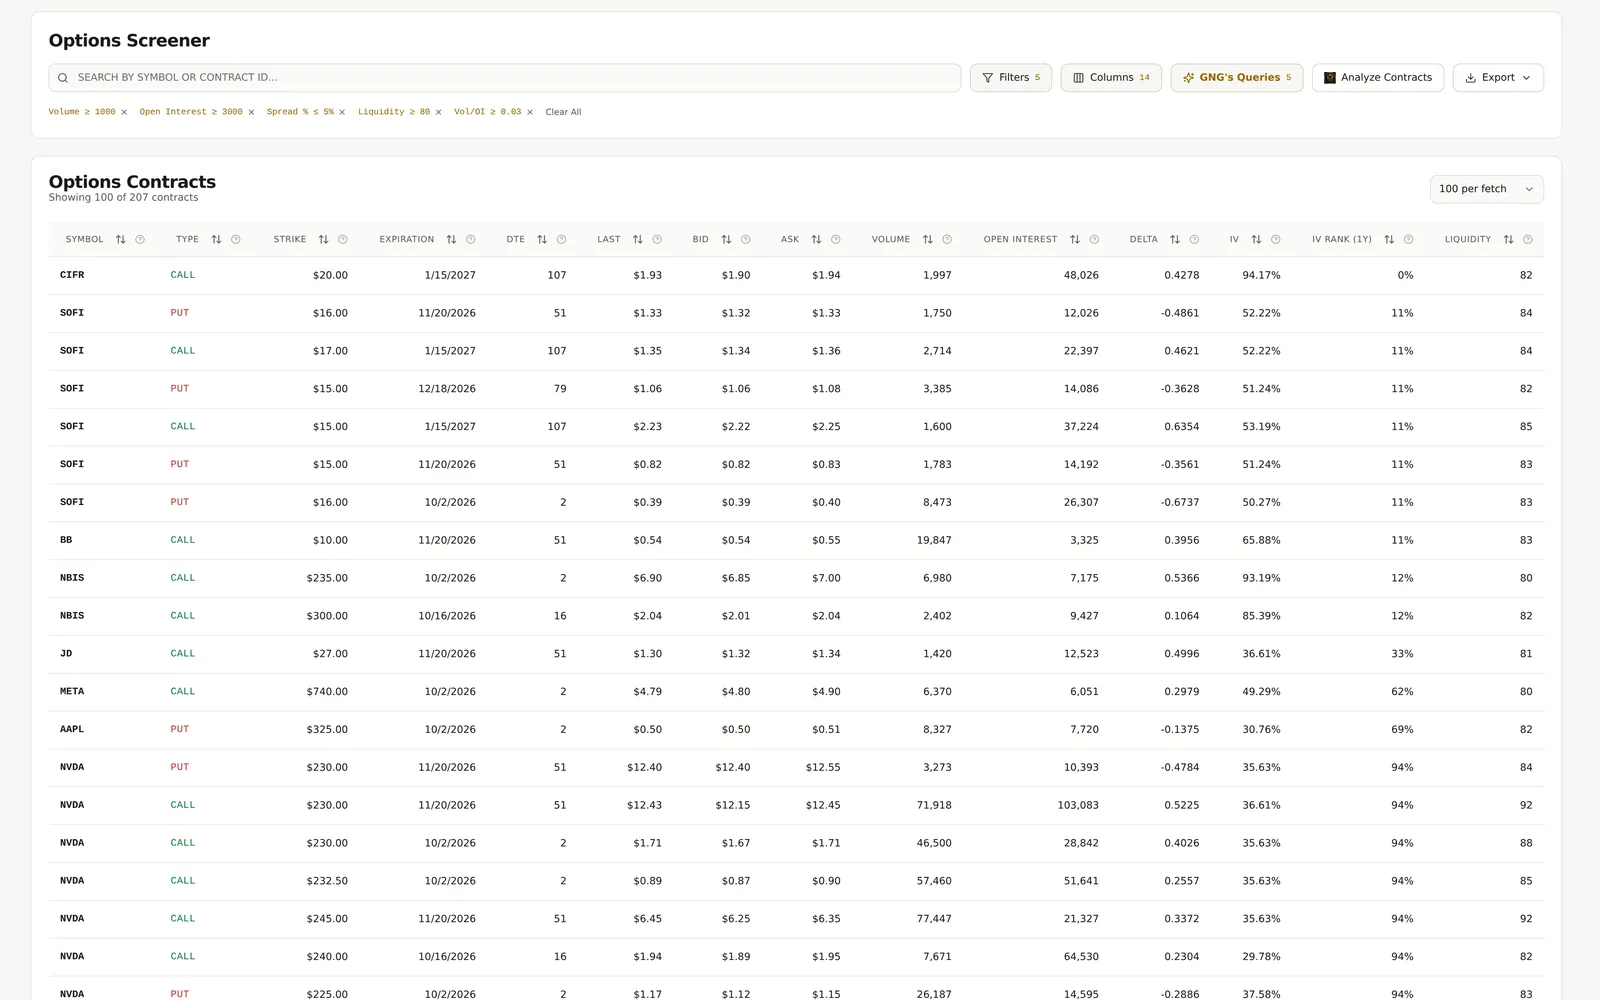
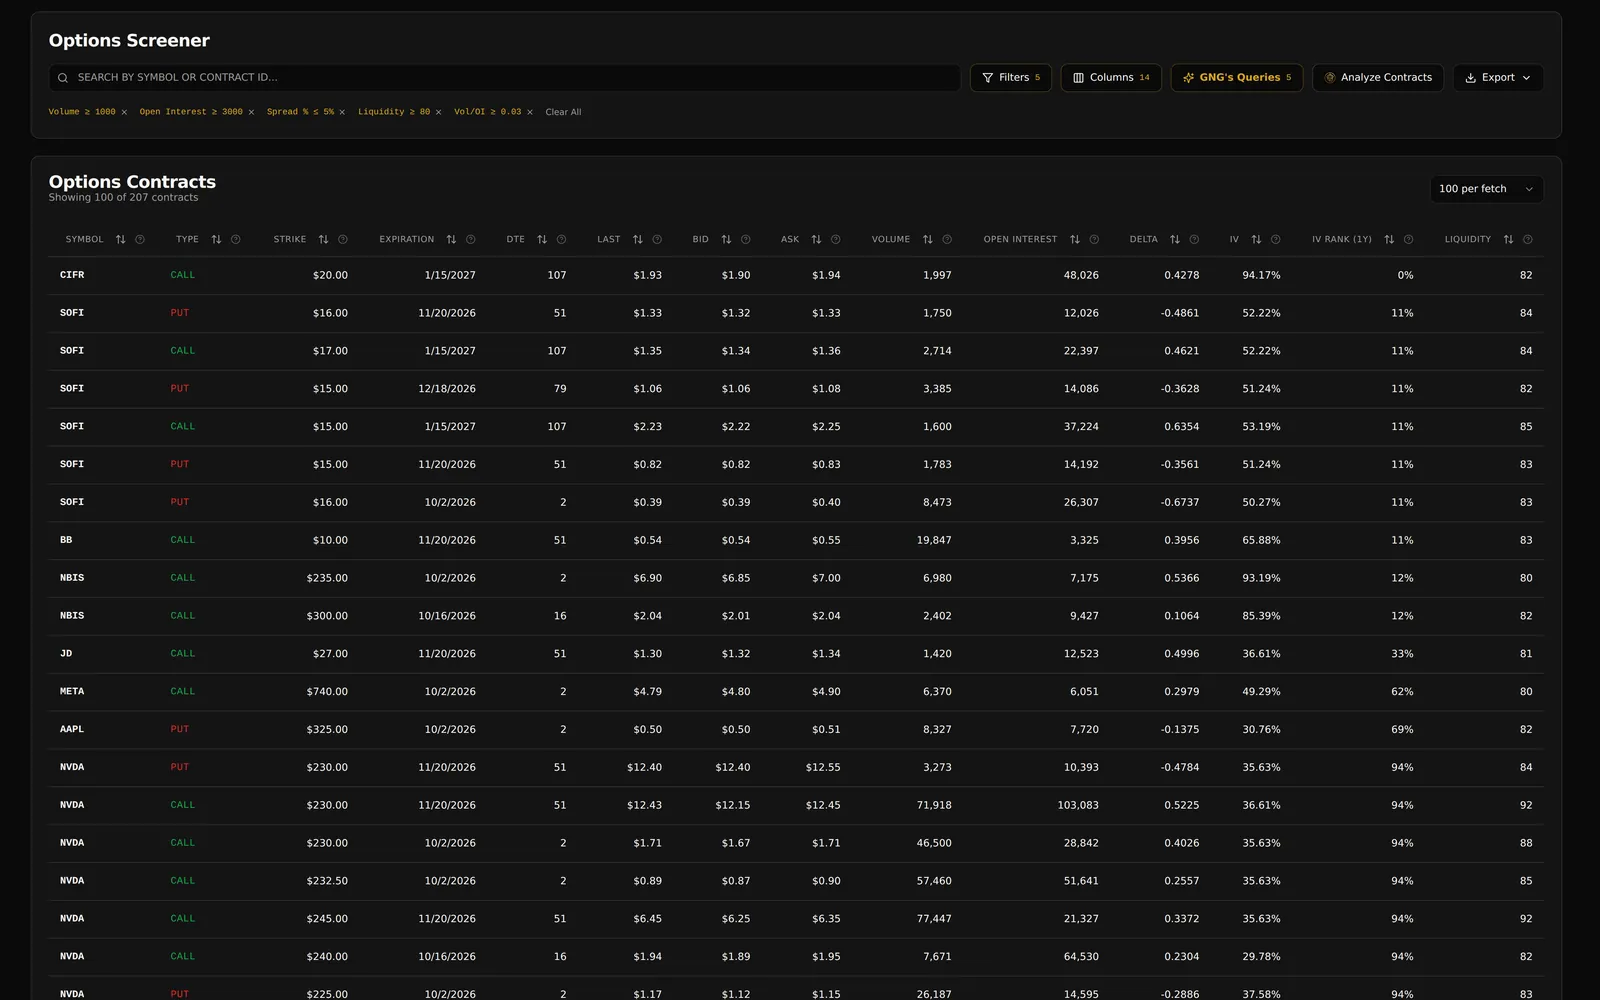
An options scanner, also called an option screener, checks many option chains at once and returns only the contracts that match your rules. The GNG Options Screener puts US-listed calls and puts on stocks and ETFs in one sortable table. Filter by ticker, expiration, strike, volume, open interest, delta, gamma, theta, vega, rho, implied volatility, IV rank, or IV percentile, then sort the matches to compare them side by side.
IV rank and IV percentile show whether options on a stock are priced for more movement than usual. IV rank places the underlying's current implied volatility between its low and high, from 0 to 100. IV percentile shows the share of past readings below today's level. Both use up to one year of daily readings. Ticker metrics add put/call volume and open interest ratios, 25-delta skew, and gamma and vega exposure.
Start with your own filters or a prebuilt GNG query, such as the premium collection scan for selling puts. A liquidity score built from volume, open interest, and the bid-ask spread helps you set aside contracts that are hard to trade. Open a contract to check its quotes, Black-Scholes value, probability fields, and history, then export the results. The Options Screener is included with GNG Pro and higher plans.
What you get
- Calls and puts by strike, expiration, volume, and liquidity
- Greeks, implied volatility, IV rank, and IV percentile
- Black-Scholes value and edge versus the market mark
- Put/call ratios, 25-delta skew, and gamma exposure
- Prebuilt options scans with a written methodology
- Custom columns and exports to CSV, Excel, or PDF
Inside the tool
Contract detail view
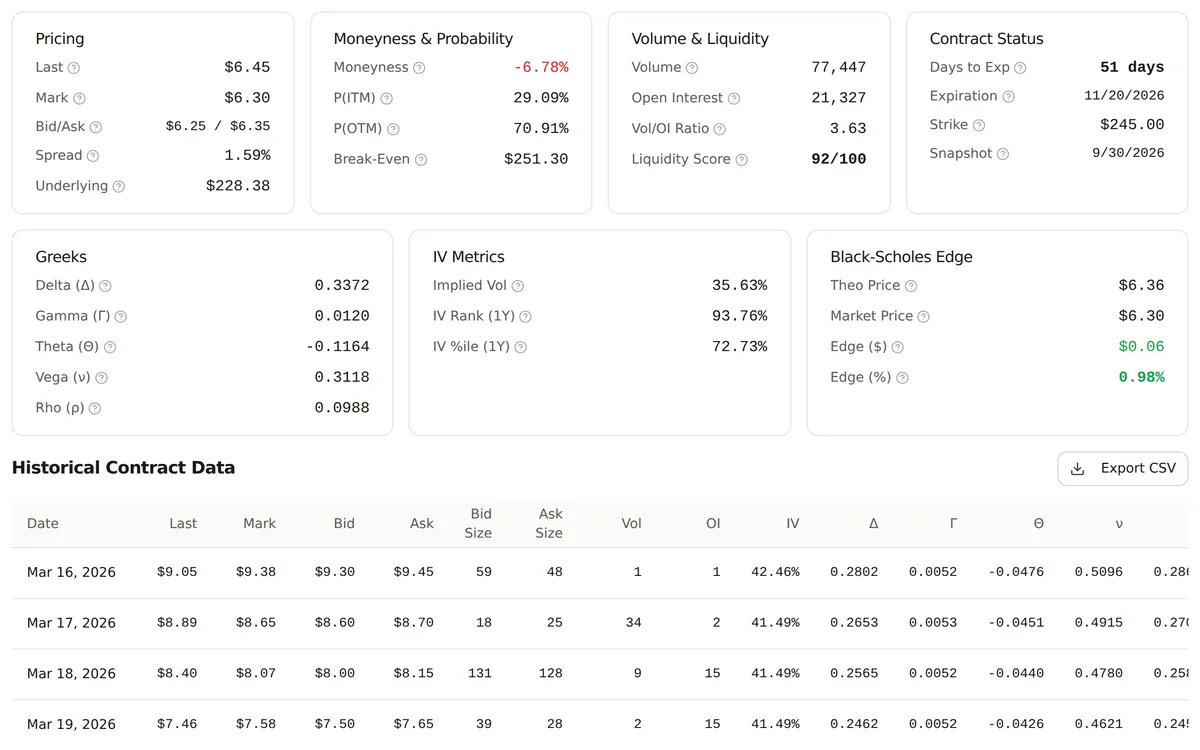
Open a contract to inspect its quotes, Greeks, IV history, and model values where the required data is available.
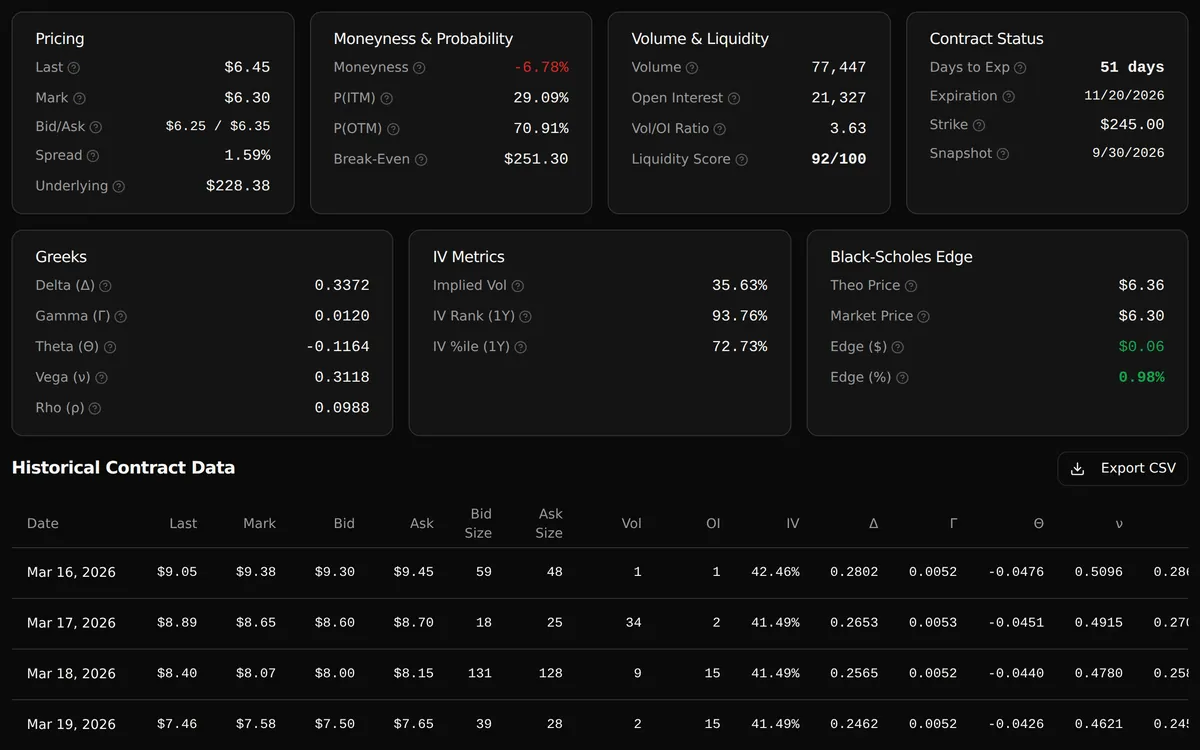
The sample call’s detail view gathers pricing, moneyness, estimated in-the-money and out-of-the-money probabilities, liquidity, Greeks, and volatility metrics. The Black-Scholes panel compares theoretical price, built from the underlying price, implied volatility, time to expiration, a Treasury rate, and dividend yield, with the market mark. The history table below lets you inspect earlier contract snapshots, while the snapshot date identifies the data being shown.
- Compare model values with observed contract quotes
- Inspect the bid-ask spread and break-even price
- Model fields depend on the required inputs being available
- An edge is a model estimate, not a promise of profit
Prebuilt GNG queries
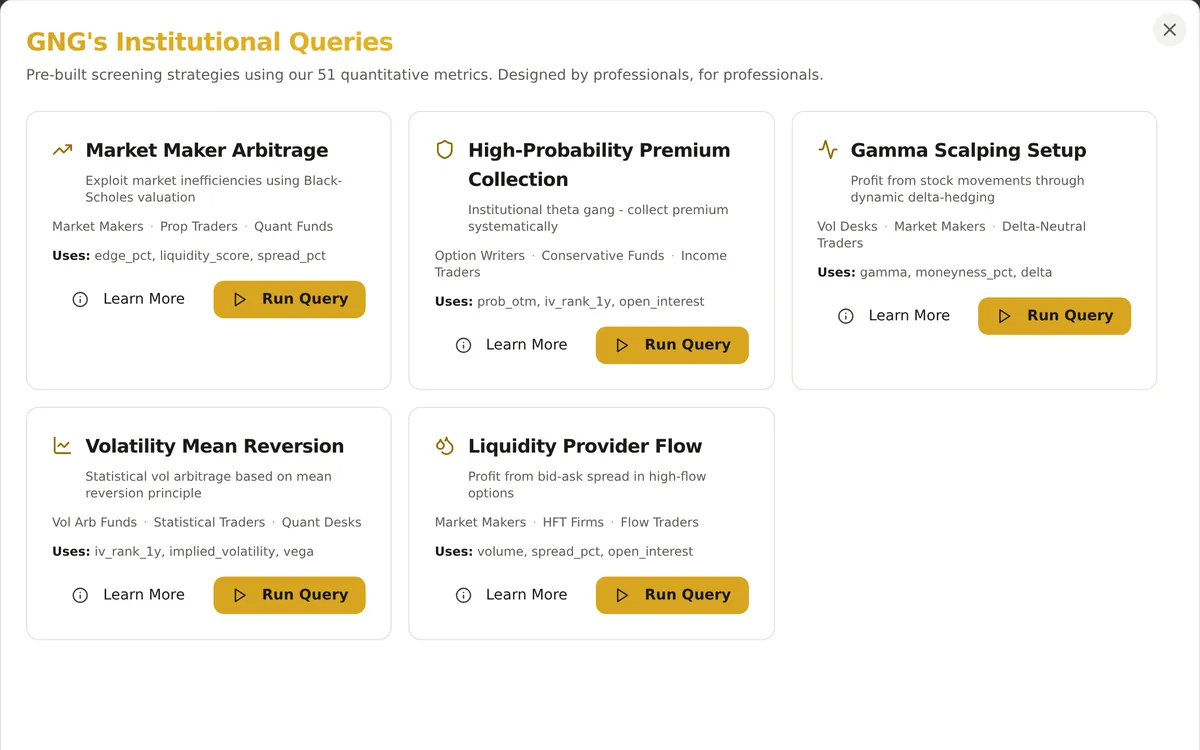
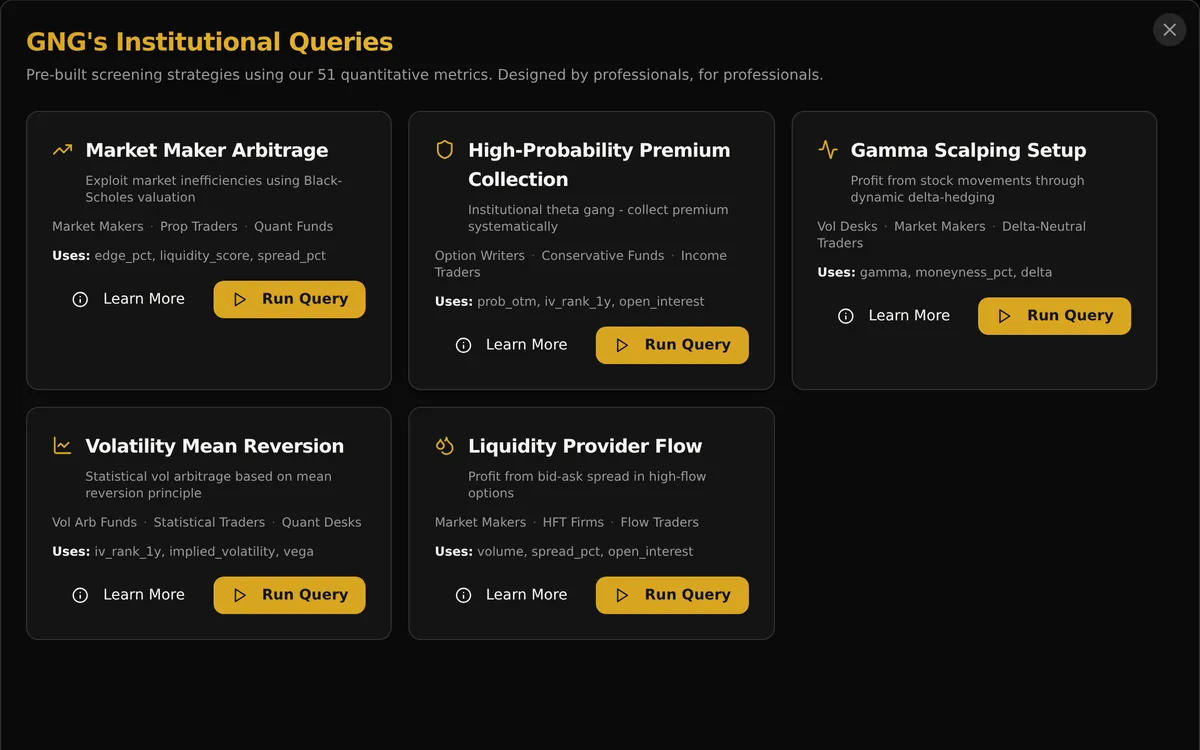
Start from a prebuilt screen, read how it works, then run it with one click.
The query menu offers five prebuilt option scans: pricing edge, put premium collection, gamma, volatility mean reversion, and liquidity. Each has a Learn More action for its methodology and a Run Query action that loads its filters and sort order. Review the criteria, run the scan, then adjust any filter to fit your own research.
- Read the methodology behind a prebuilt screen
- Load the filters and sort order together
- Treat query results as research candidates, not trade recommendations
Capabilities
Define contract criteria
Search by ticker or contract ID and combine filters for calls or puts, strike, expiration, and days to expiration. Add volume, open interest, volume-to-open-interest ratio, spread, or liquidity conditions to narrow the contracts you want to inspect.
- Set minimum and maximum values for numeric fields
- Use date ranges and contract-type selections
- Liquidity score blends volume, open interest, and the bid-ask spread
Screen Greeks and IV rank
Screen on delta, gamma, theta, vega, rho, and implied volatility. IV rank and IV percentile provide historical context for volatility, while theoretical edge and probability fields can form part of a more specific screen.
- Combine volatility criteria with trading-activity filters
- Choose whether numeric filters include missing values
Add ticker-level context
Ticker metrics summarize each underlying's option chain: put/call volume and open interest ratios, total call and put volume, average implied volatility, 25-delta skew, and gamma and vega exposure. Filter on them like any contract field to narrow a screen to the underlyings you want to study.
- Skew compares 25-delta put and call implied volatility
- Combine ticker metrics with contract filters in one screen
Arrange your table
Select the columns you want to compare and sort by the fields that matter to your research. Add custom column filters alongside the standard filters, review the active criteria, and remove a condition or clear the screen.
- Choose the results batch size and load more matches
- Keep the selected columns when exporting the screen
Chart contract history
Inside a contract, select chart series for the underlying stock, option prices, volatility, activity, or Greeks. Overlay the available history to examine how a contract’s price and sensitivities changed together.
- Toggle last, mark, bid, and ask series
- Compare volume or open interest with volatility and Greeks
- Open the underlying stock for further research
Export your research
Download filtered screener results as CSV, Excel, or PDF using the current column selection. Export an individual contract’s historical observations as CSV when you need to work with its time series separately.
- Screen exports respect the active filters and sort order
- Narrow broad screens when the export row cap is reached
Scan options on mobile
On phones, a compact contract list replaces the wide desktop table. Tap a contract to open its details, and use the responsive filter and column controls to continue your research on a smaller screen.
- Contract details open in a scrollable dialog
- Desktop tables retain sortable columns
Discuss selected results
The Analyze Contracts action opens GNG Analyst with the displayed contract data and screening context. Use it to investigate a result or clarify the metrics, subject to the AI access and credits available on your account.
- Carry the current search and active filter context into the conversation
- Review the screener data before acting on an interpretation
How it works
Choose the contracts to scan
Search a ticker or contract ID, pick calls or puts, and set strike and expiration limits, or load a prebuilt GNG query and read its methodology first.
Add Greeks and volatility limits
Narrow the scan with delta, theta, vega, implied volatility, IV rank, or IV percentile, then add volume, open interest, and liquidity limits so thin contracts drop out.
Sort and inspect the matches
Sort by the fields that matter to you, then open a contract to check its snapshot date, quotes, Black-Scholes value, and history, and chart how they changed.
Export or discuss the results
Export the screen as CSV, Excel, or PDF, download a contract's history as CSV, or send the displayed contracts to GNG Analyst with Analyze Contracts.
Common questions
- What is an options scanner?
- An options scanner, or option screener, searches many option chains for contracts that match your rules, such as delta, days to expiration, IV rank, volume, and open interest. The GNG Options Screener does this for US-listed calls and puts.
- Is the options screener free?
- No. The Options Screener is included with GNG Pro and higher plans. Create a free GNG account first, then upgrade to GNG Pro to use it.
- Can I screen options by Greeks and implied volatility?
- Yes. Combine delta, gamma, theta, vega, rho, and implied-volatility filters with strike, expiration, volume, open interest, and other contract criteria. IV rank and IV percentile are also available.
- What is the difference between IV rank and IV percentile?
- IV rank shows where current implied volatility sits between its lowest and highest reading, from 0 to 100. IV percentile shows the share of past readings below today's level. The screener computes both for each underlying from up to one year of daily readings.
- Can I use it as a cash-secured put screener?
- Yes. Filter puts by delta, days to expiration, IV rank, and probability of expiring out of the money. The premium collection query loads puts with a 70% or higher modeled chance of expiring out of the money and an IV rank of 60 or more. Treat results as research candidates.
- Does the options screener provide live quotes?
- No. The screener shows the latest contract snapshot, not live quotes. Check the snapshot date in the contract detail view before you use the quotes or derived metrics in your research.
Create a free GNG account, then upgrade to GNG Pro to run the options scanner.
Free to join. No credit card. Takes seconds.
Options involve substantial risk. Screener output is for information only and is not a recommendation to trade any contract.